Throughout my career, I’ve always found the “date the rate, marry the house” phrasing by mortgage professionals to be awkward. I’ve had enough trouble with “starve a cold, feed a fever.”
Aside from being trite, the implication is that you’ve figured out the U.S. financial system, and this is not the time to say that to someone making what is likely the most significant investment of their life. More on this further down in “Date The Rate” As Deceptive Advertising.”
The change in housing market optics in the new year was remarkable. h/t my wife (who wanted to get credit for providing a video this week)
——–
Did you miss last Friday’s Housing Notes?
January 26, 2024: Like A Rat On An Escalator, Housing Sales Expected To Climb
——–
But I digress…
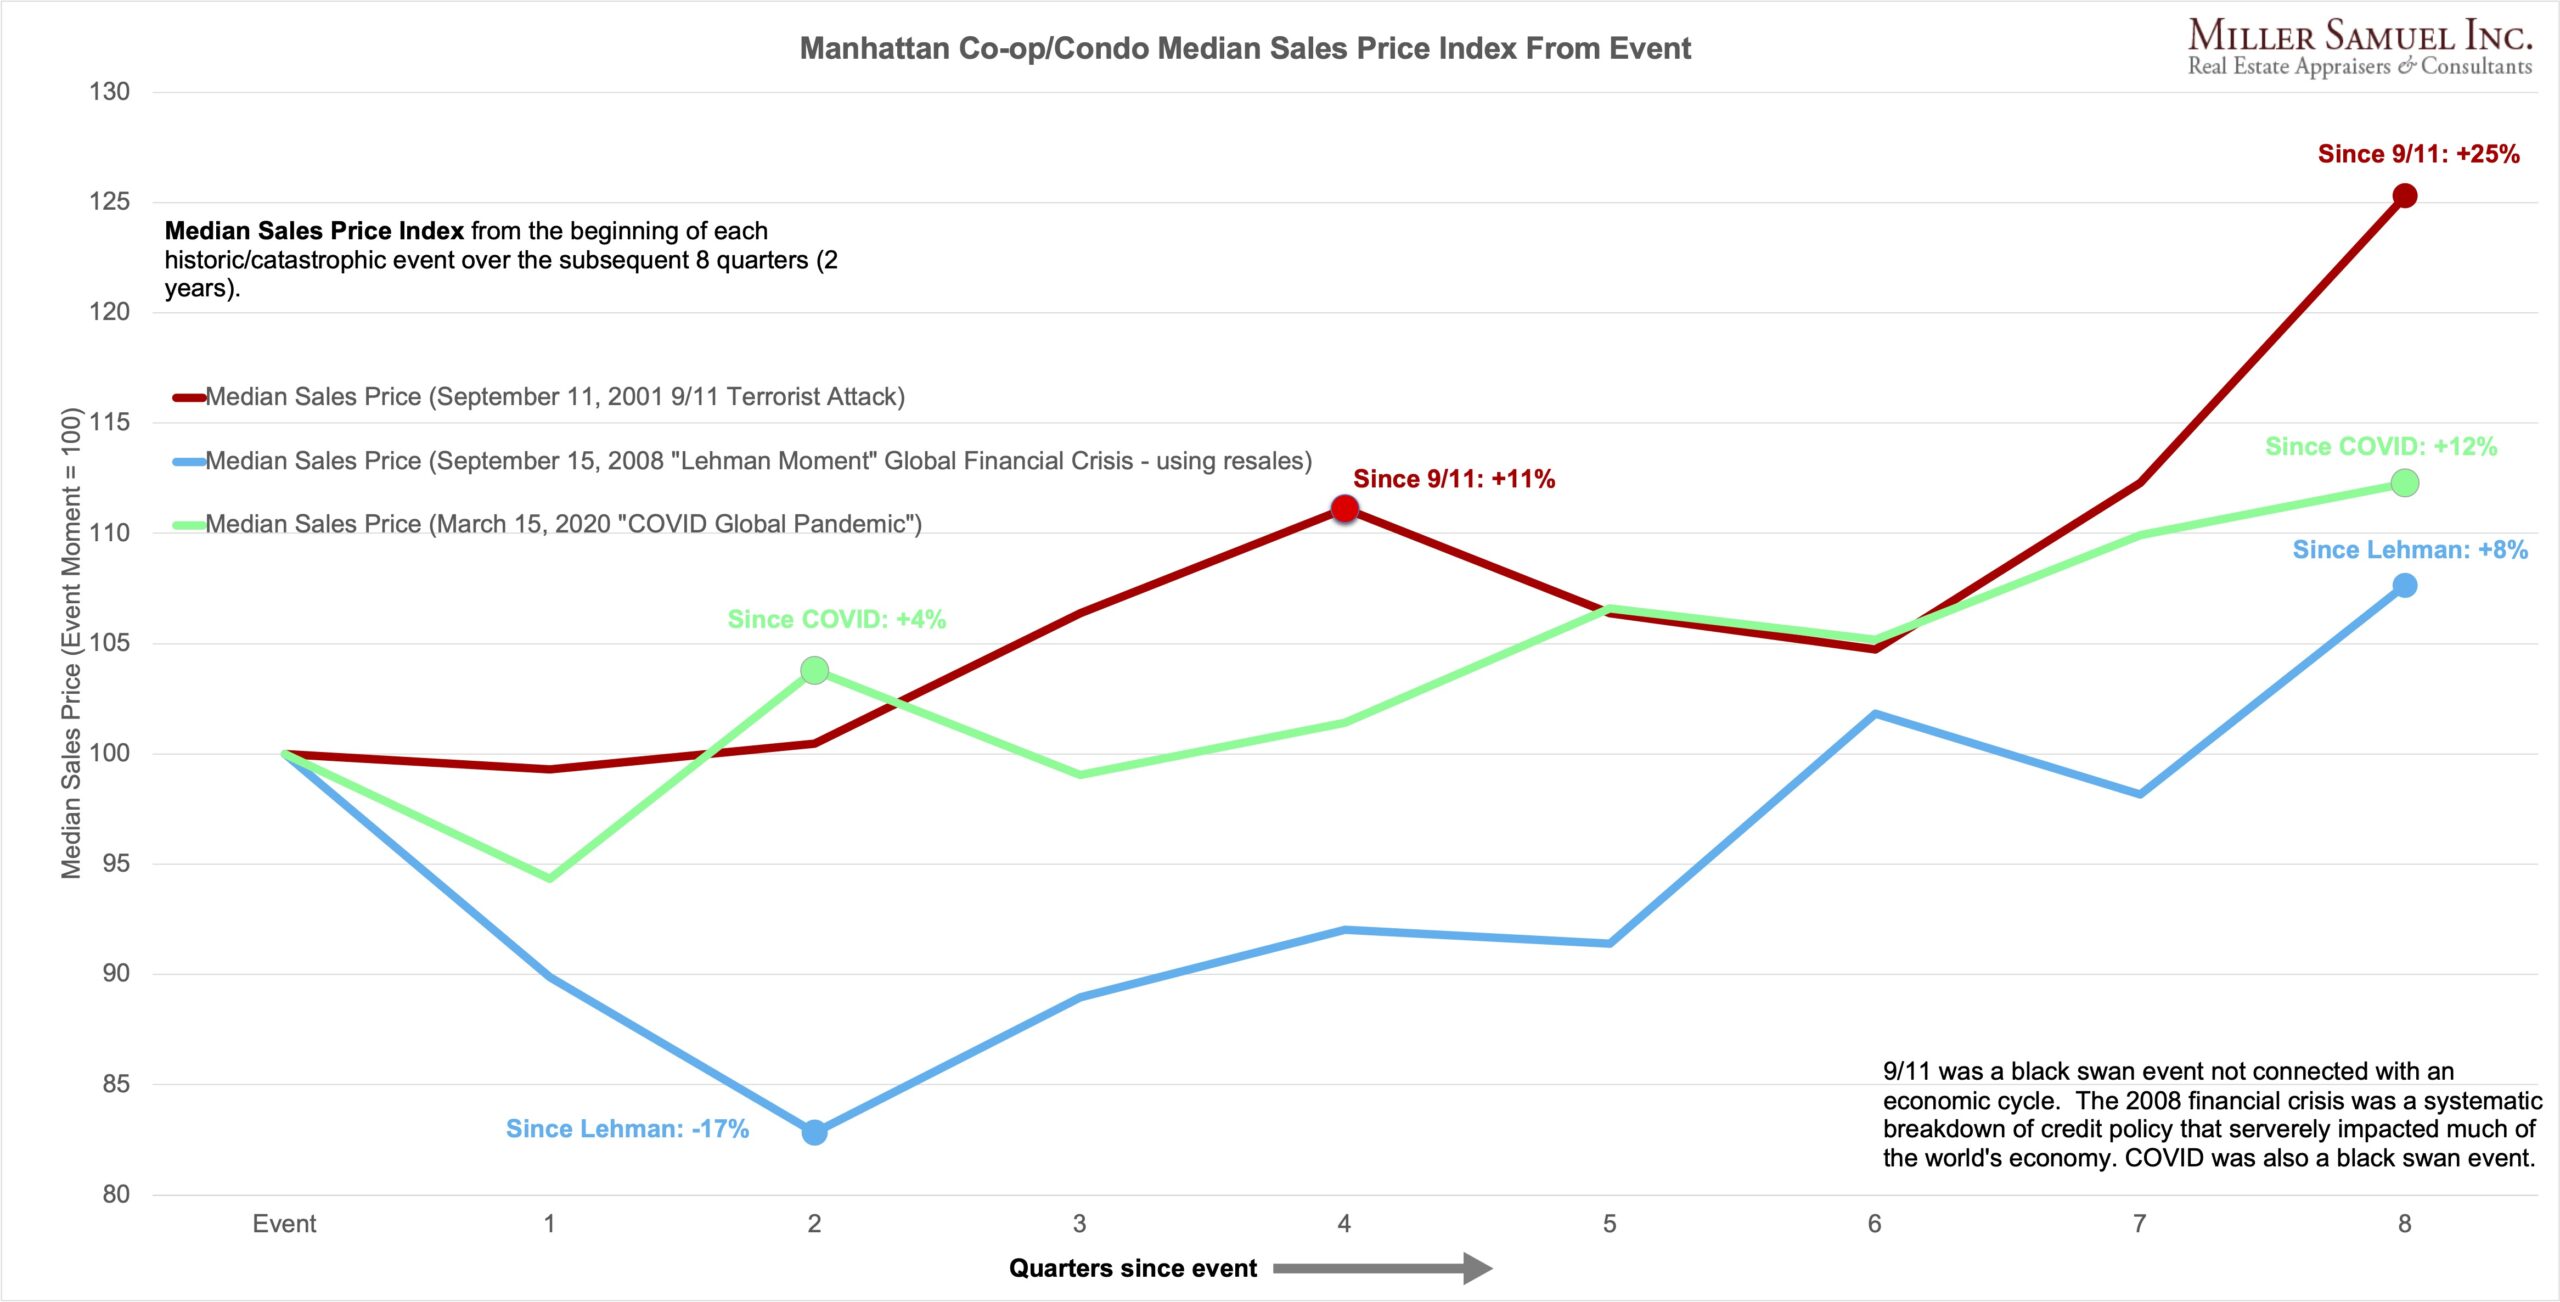
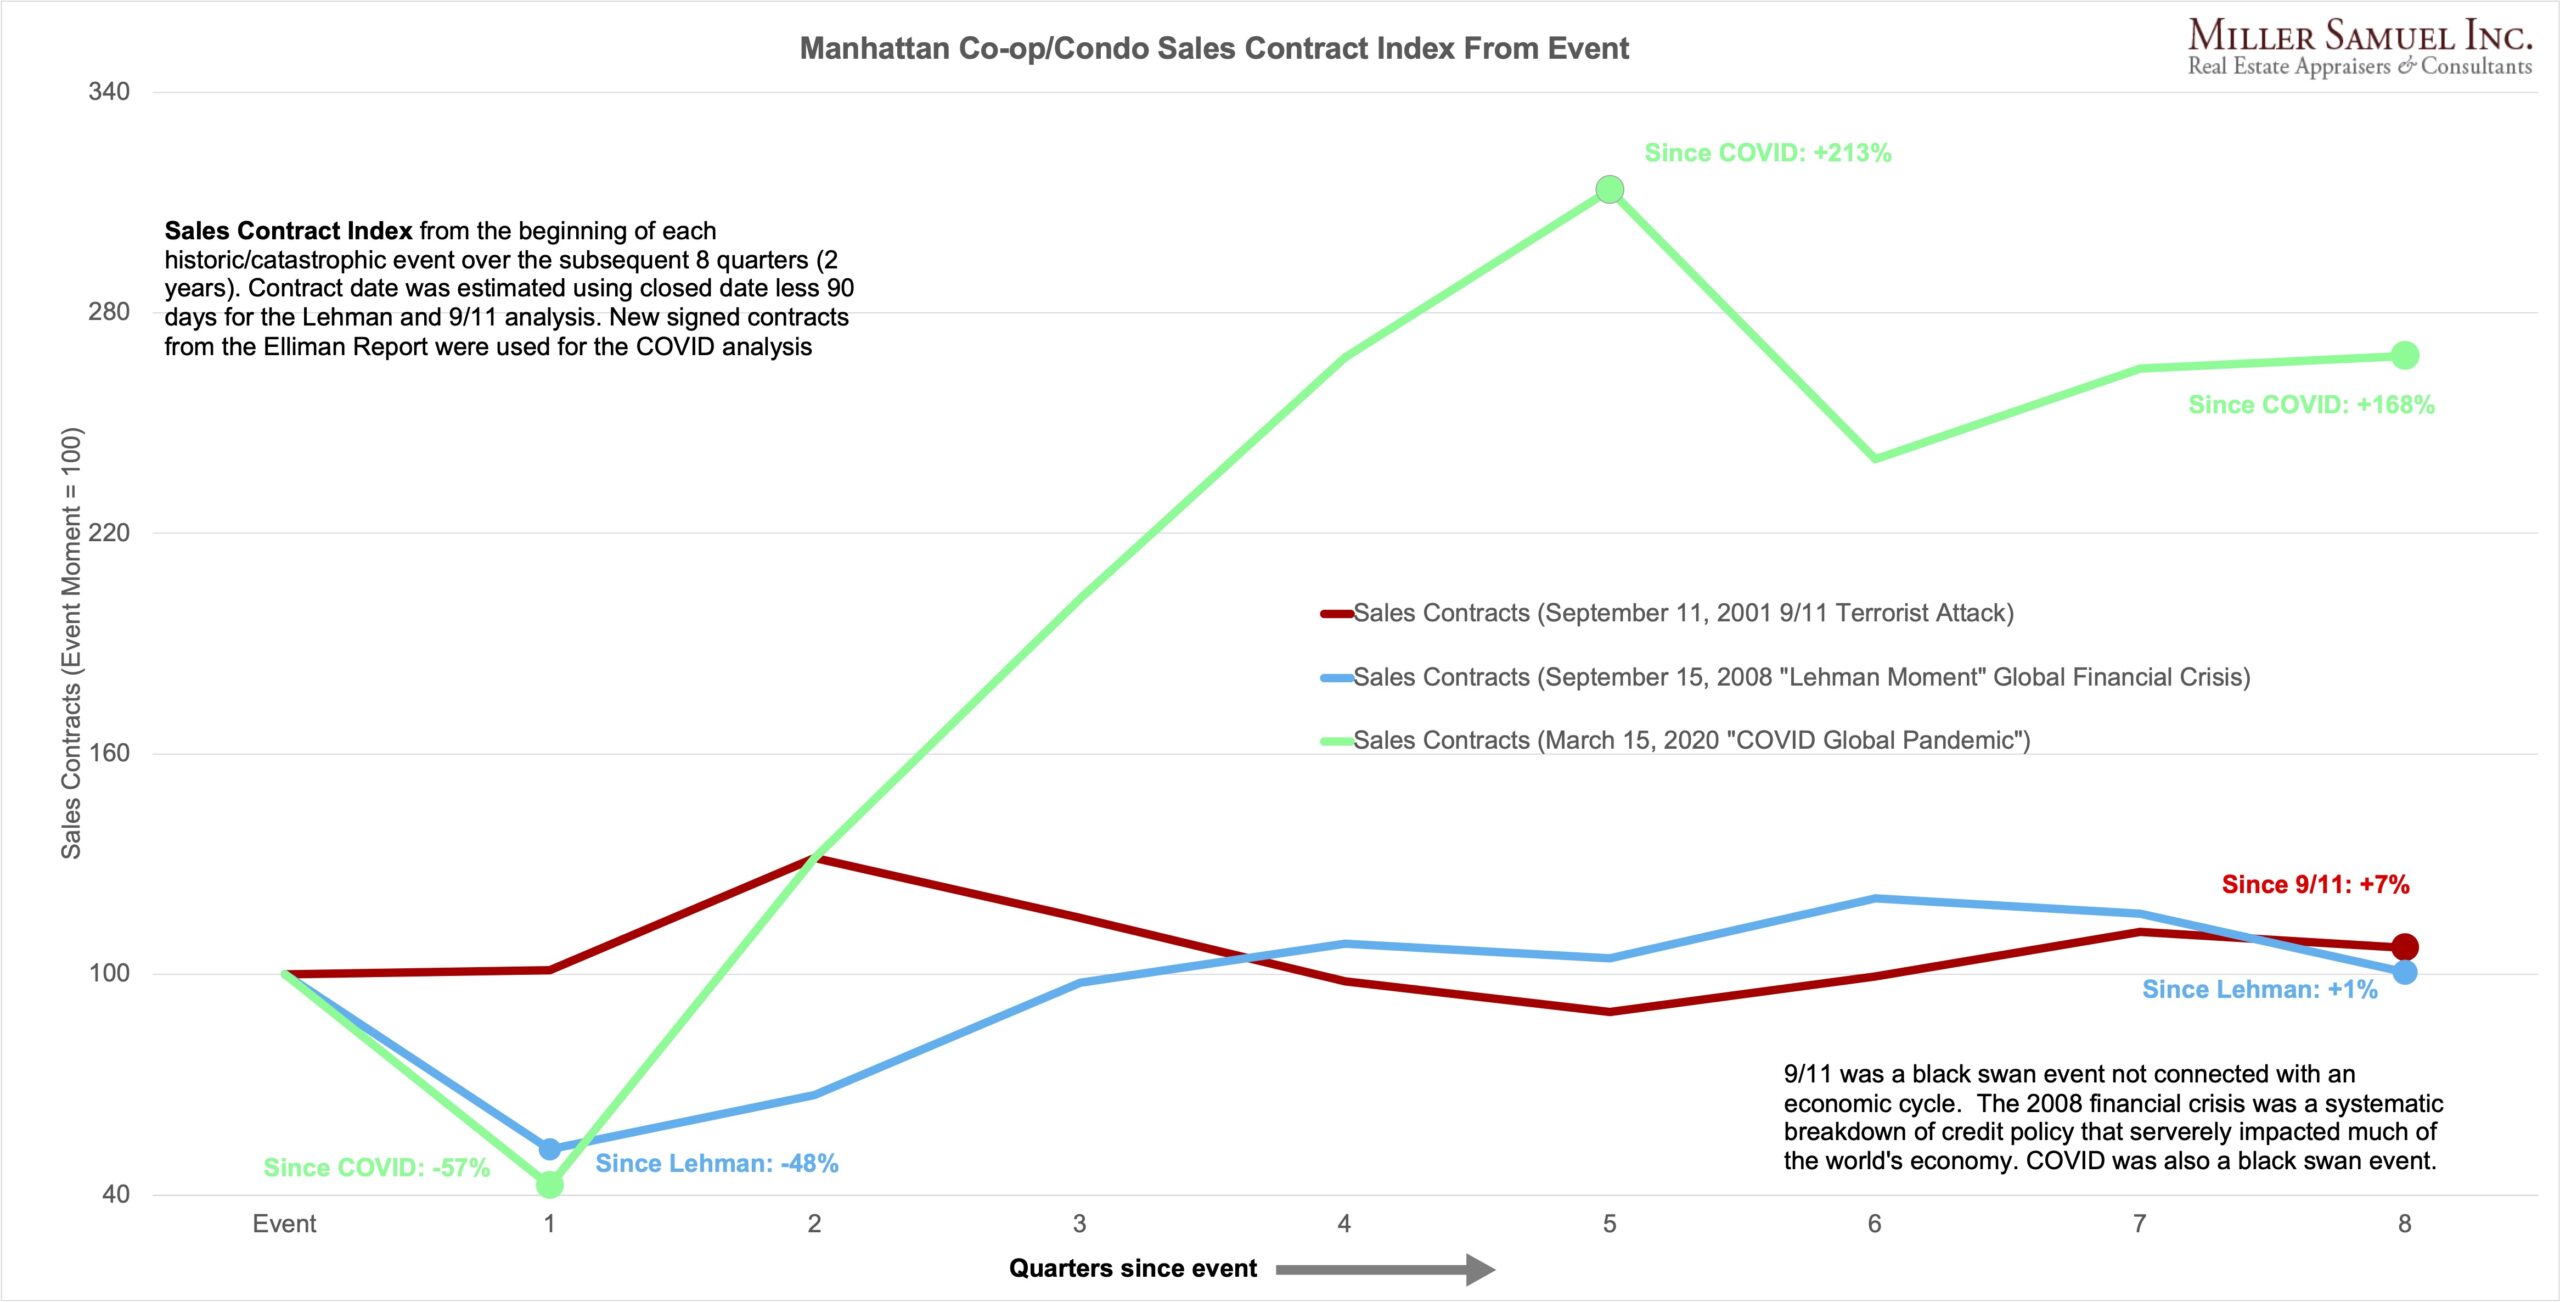
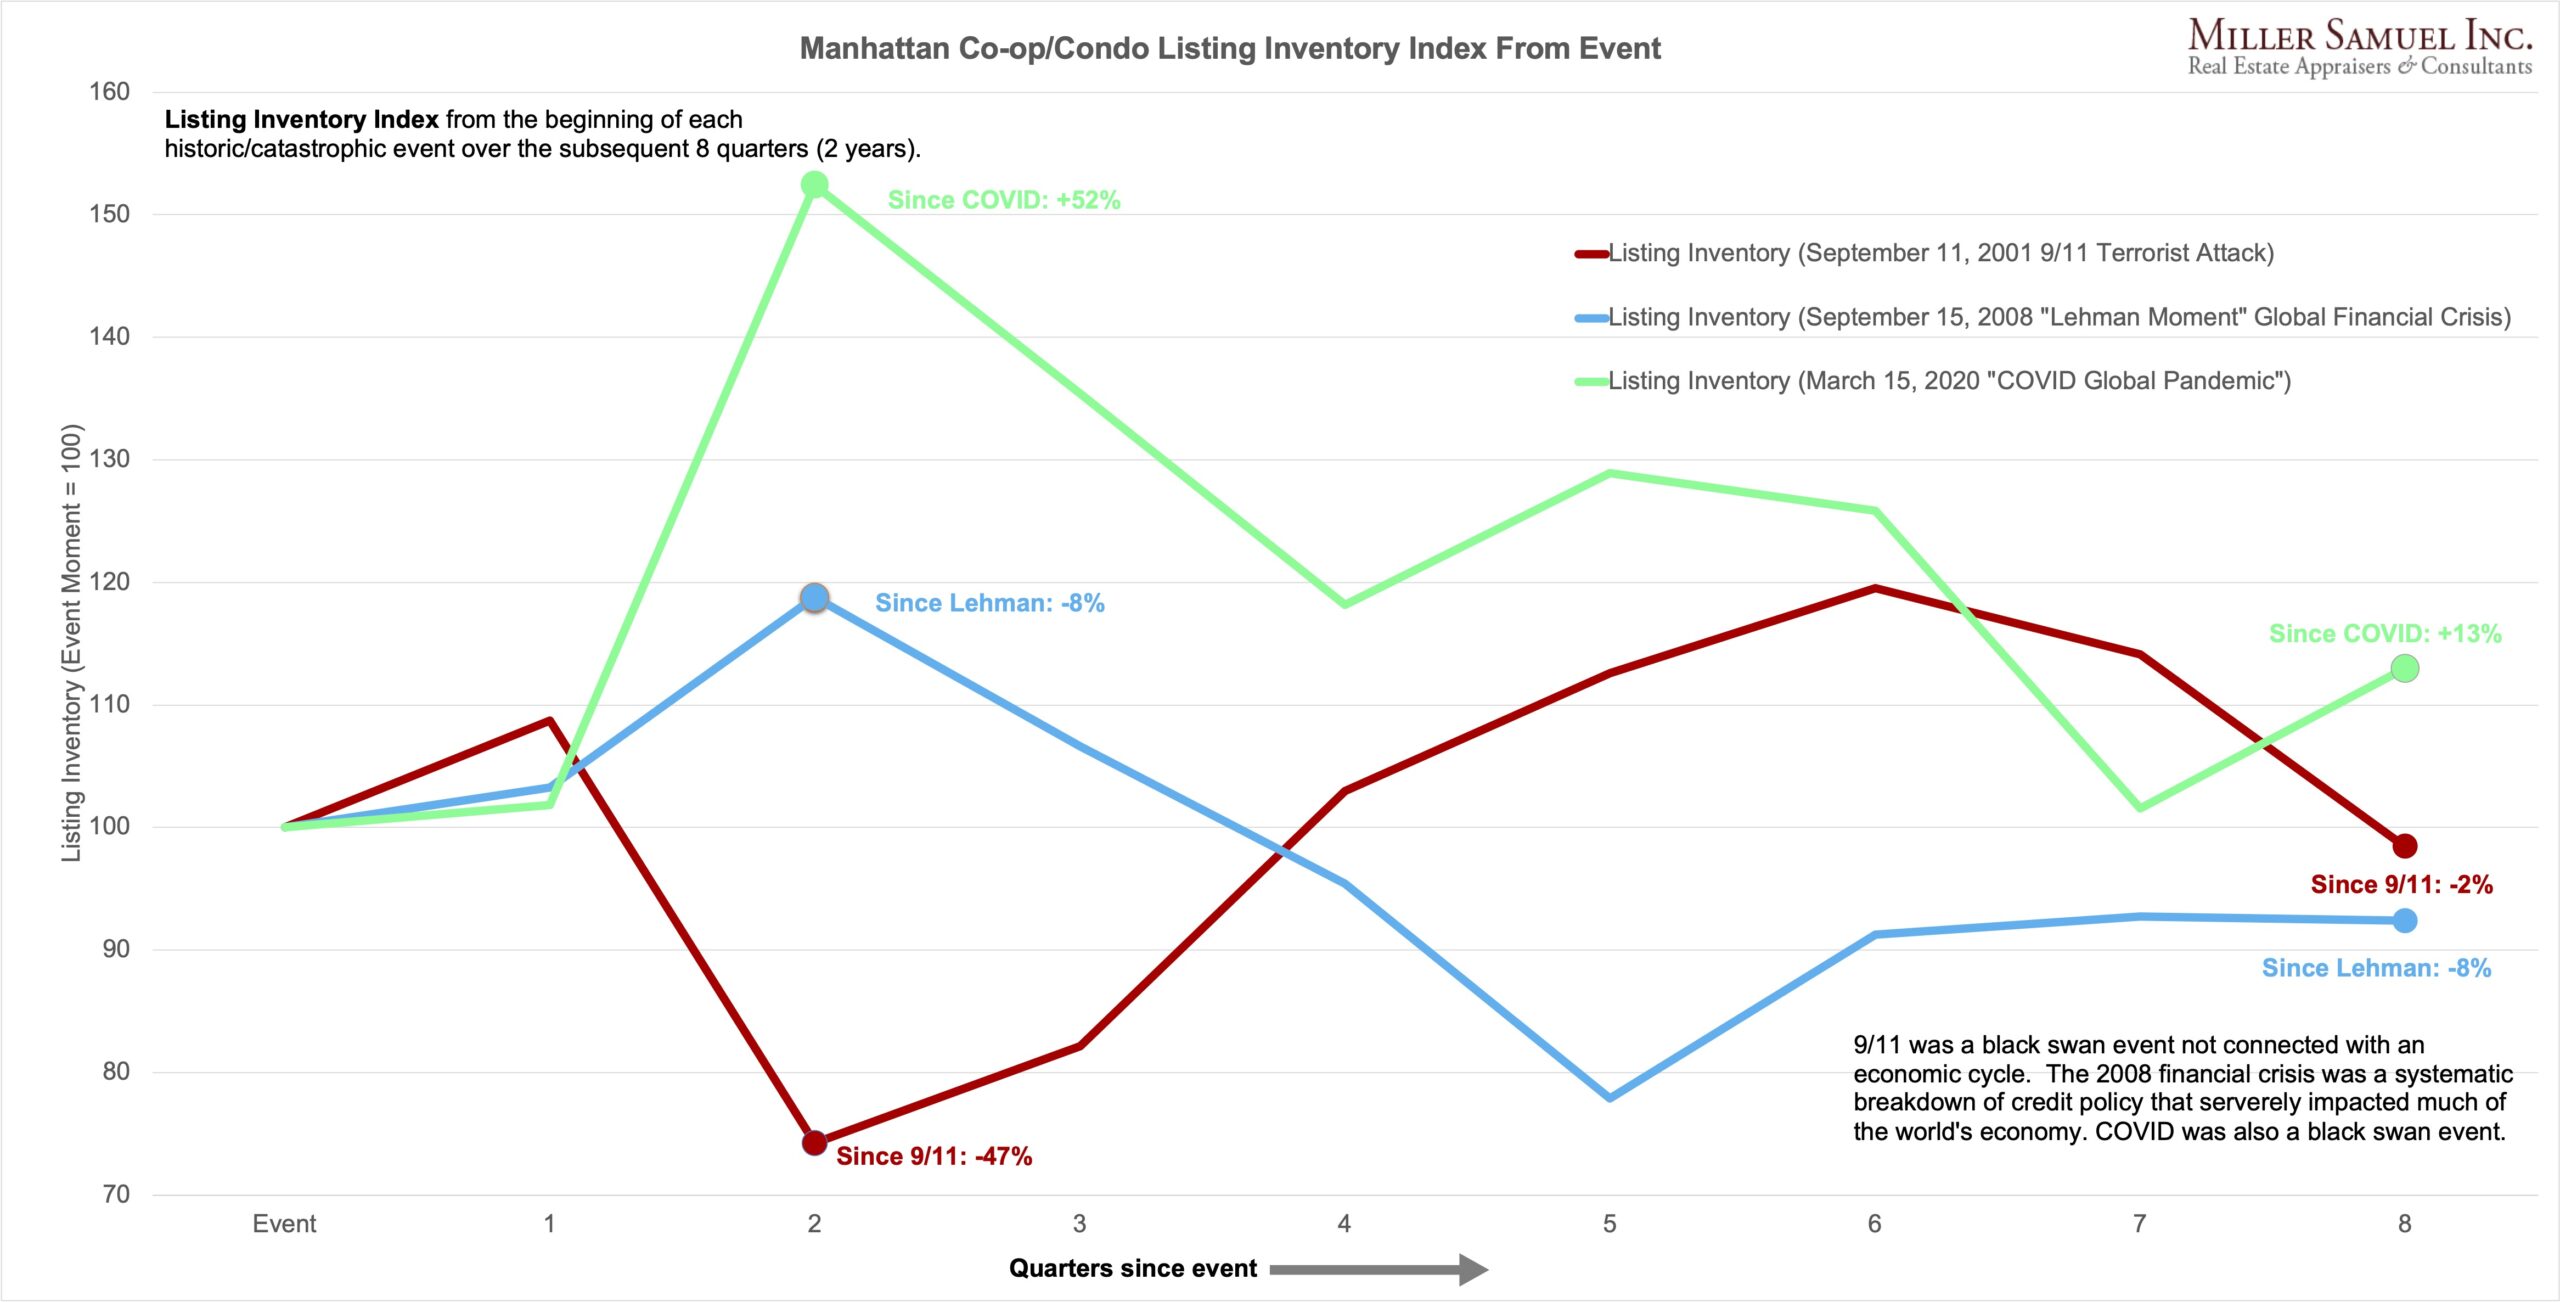
Manhattan Housing Generally Recovers From A Catastrophe In The First Two Years
Given all the economic drama and black swan events thrust at the Manhattan housing market, I continue to look at the initial impact (the first eight quarters) when the national perception seems most dire. Here are three examples using median price, sales contracts, and listing inventory.
Manhattan Decade Sees Fewer Sales But Higher Prices
I began this Decade report series in 1996 (pre-email!), two years after I began my market report series for Douglas Elliman, which has evolved quite a bit. No RLS, Streeteasy, or brokerage websites existed as a resource for the Manhattan housing market. To confess, it ran from 1989 to 1996, so it wasn’t quite a decade, but hey, it was “aspirational.” Oof, graphic design has come a loooong way since 1996! Public records for co-ops, representing about 85% of Manhattan residential sales then, were unavailable to the public and wouldn’t be available for another decade. The idea behind the “Decade” report was to create a ten-year moving window on the housing market.
Douglas Elliman just published the newest edition of our “Decade” report research today. It is an aggregation of the four quarter report releases of the past year. Every year, I now say that the first decade of its release was nicknamed “The Phonebook,” but since no one uses phonebooks anymore, I say it’s simply a “beast of data.”
Elliman Report: 2014-2023 Manhattan Decade (co-op+condo)
Here’s the cover art.


- “With the surge in mortgage rates, sales slowed and listing inventory declined.”
- – Listing inventory fell annually for the second time in a decade
- – With the spike in mortgage rates, sales fell to their second lowest level in seventeen years
- – Price trend indicators showed mixed year over year results, with median sales price rising to the second highest on record
- – Sales declined annually at a similar rate across all apartment sizes
- – Months of supply, otherwise known as the market pace, was on par with 2019 levels
- – Sales declined annually for the fifth time in six quarters
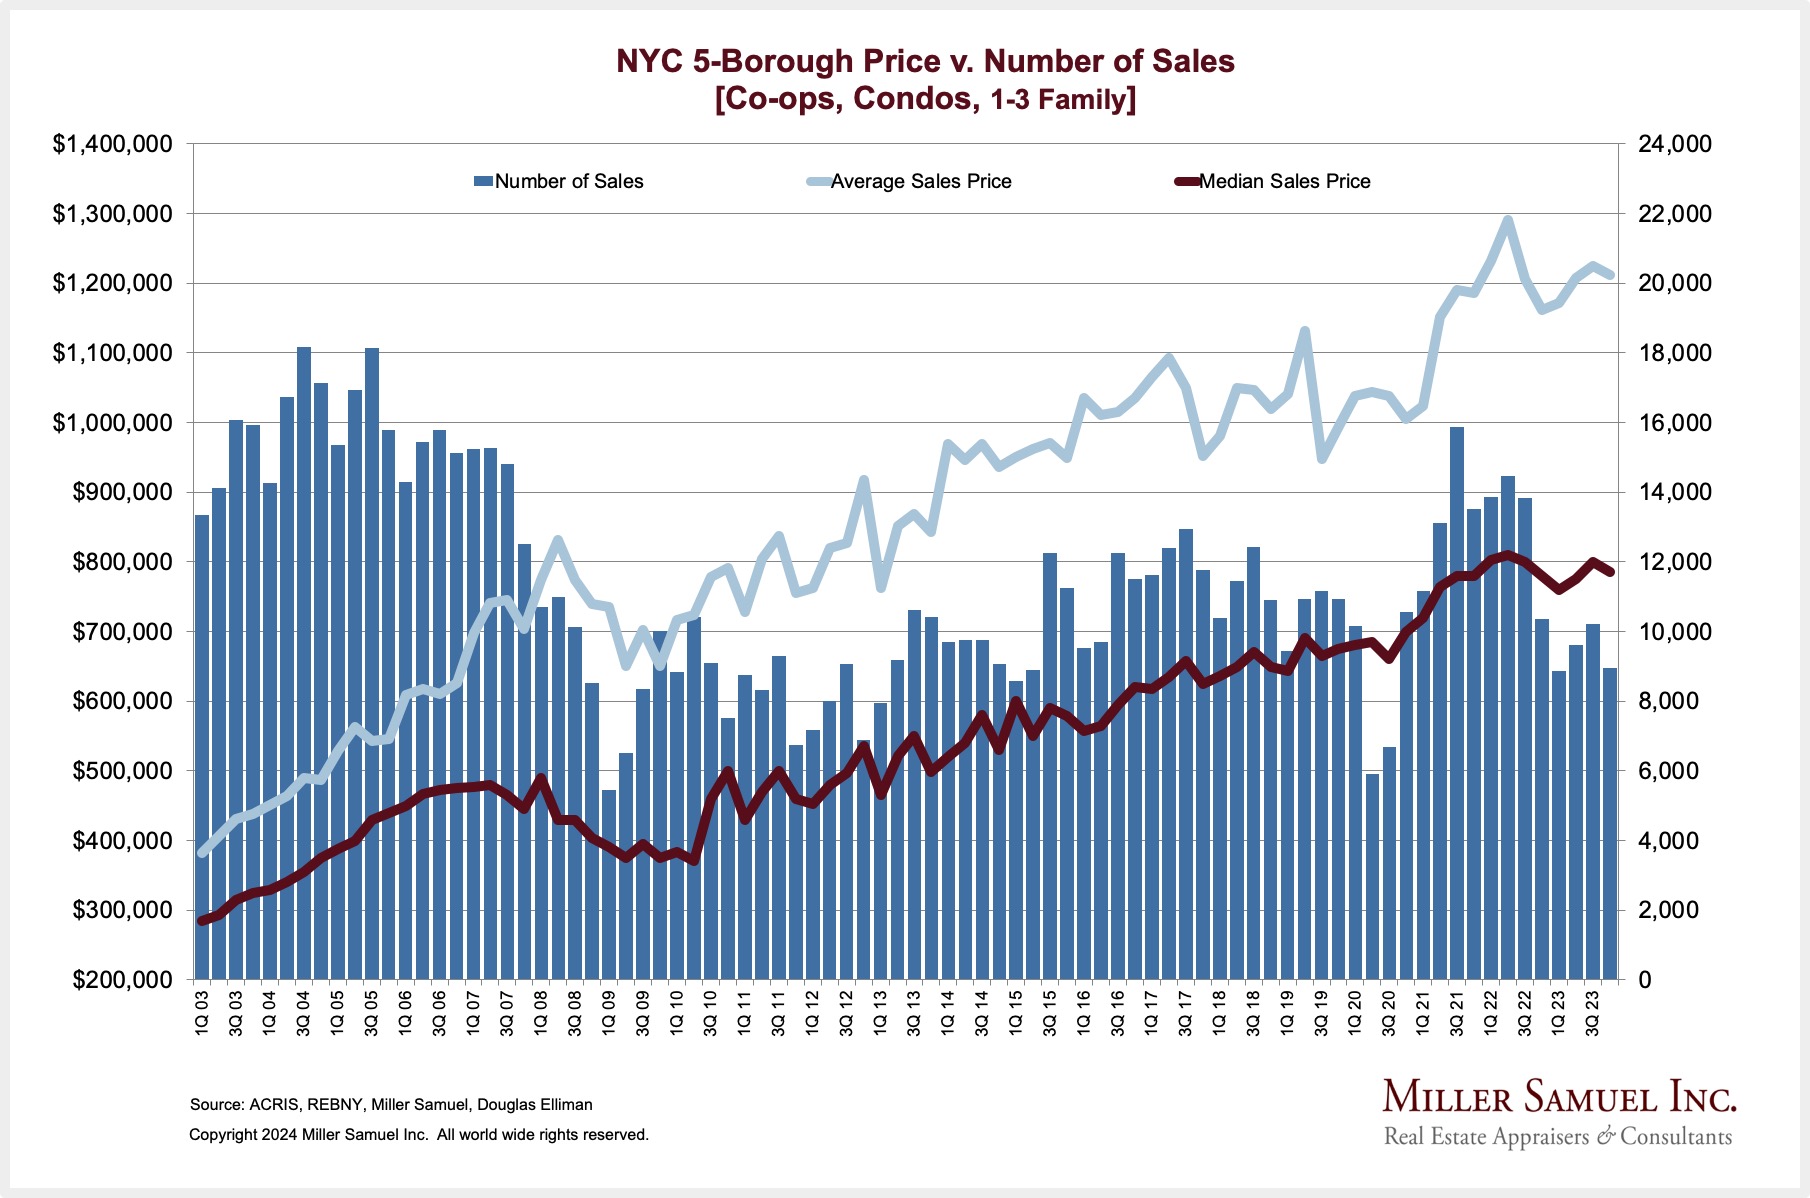
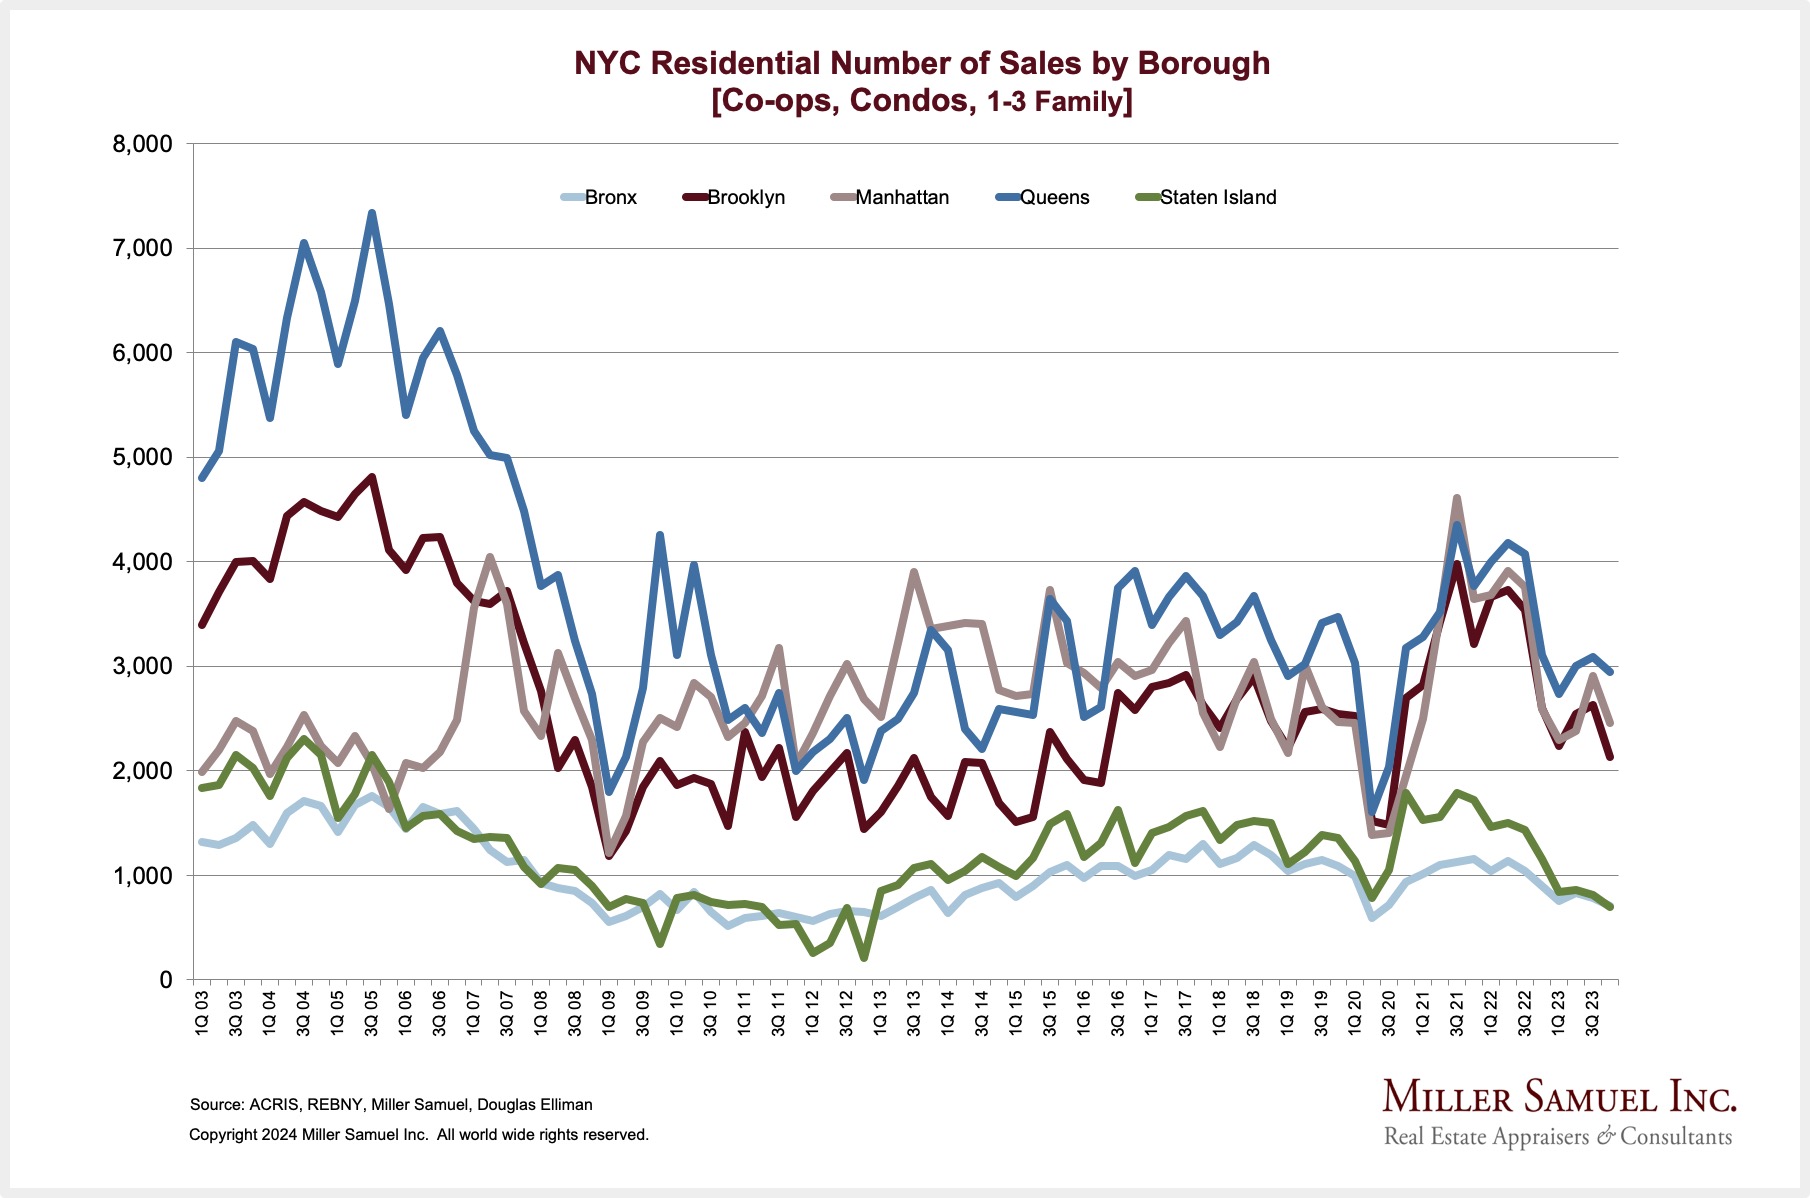
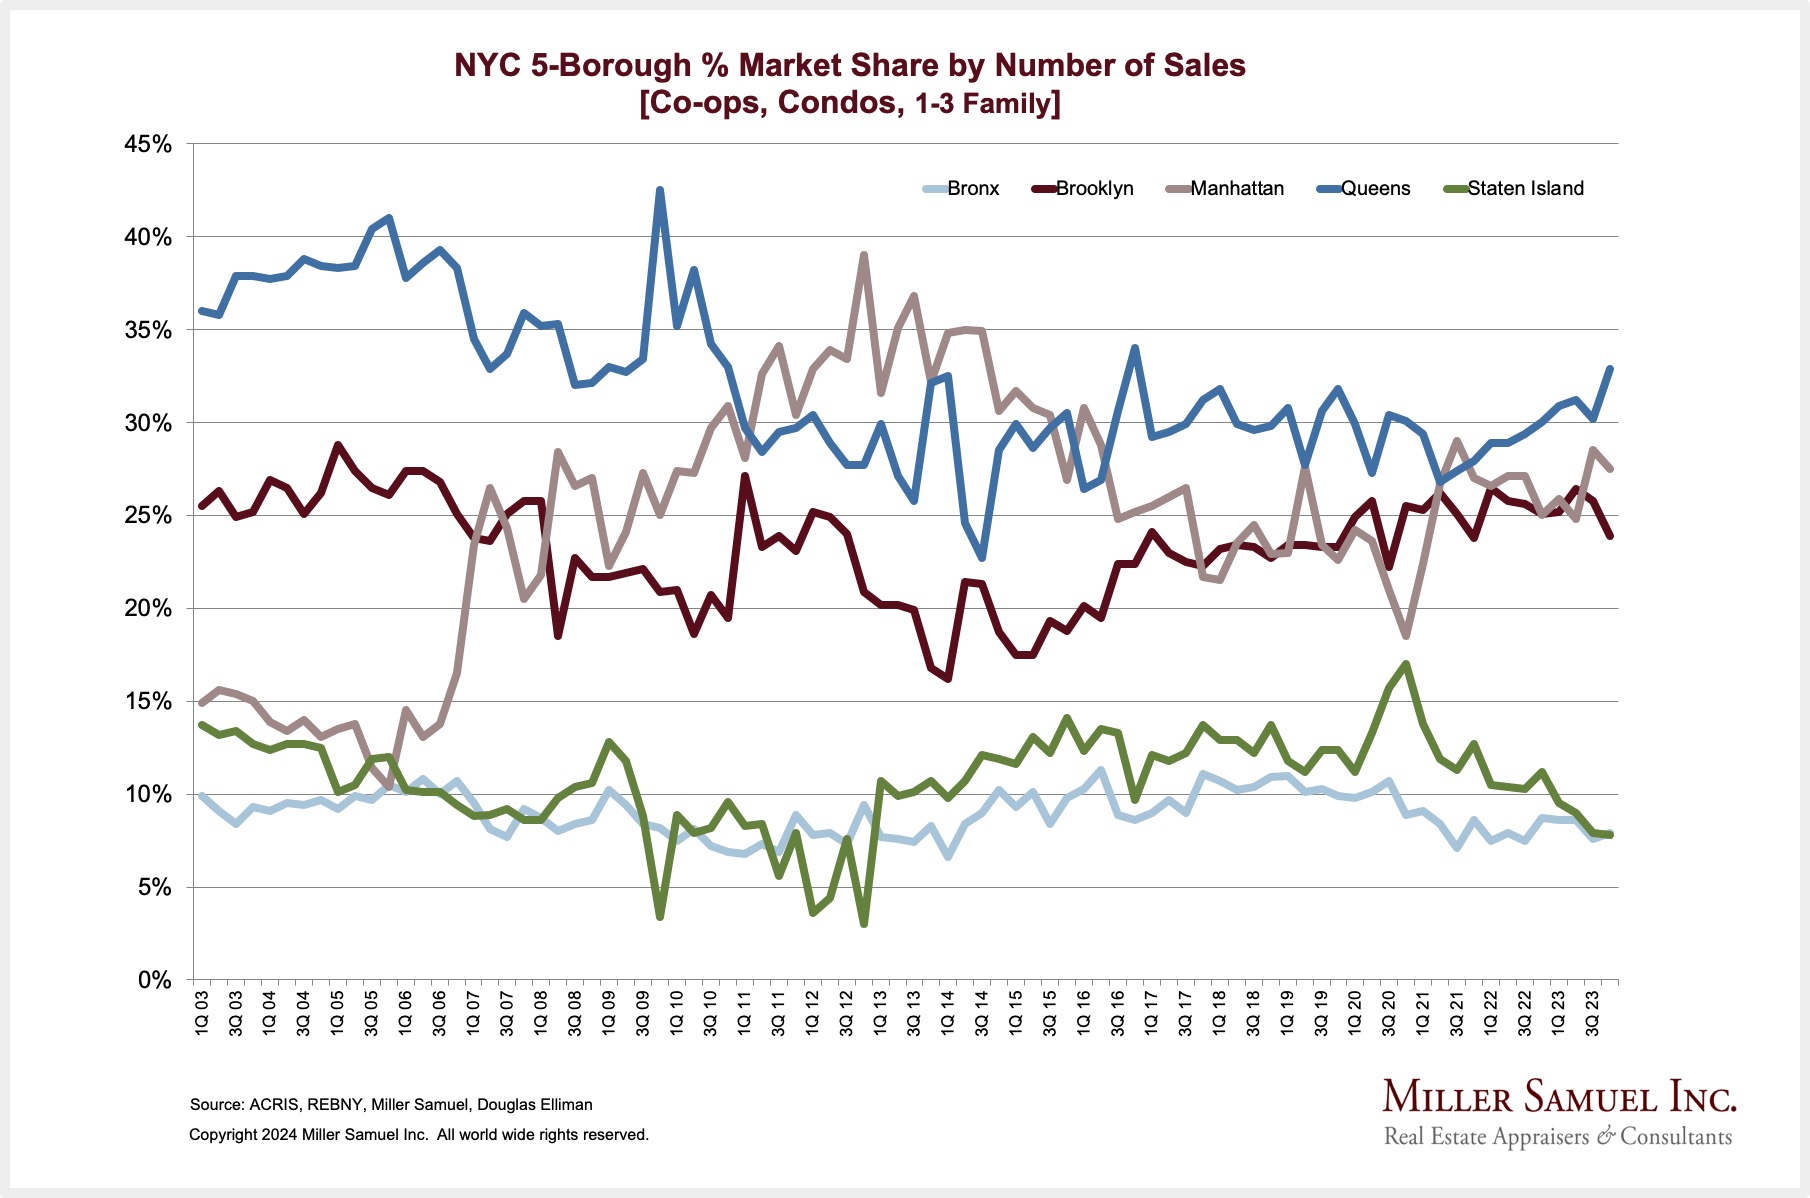
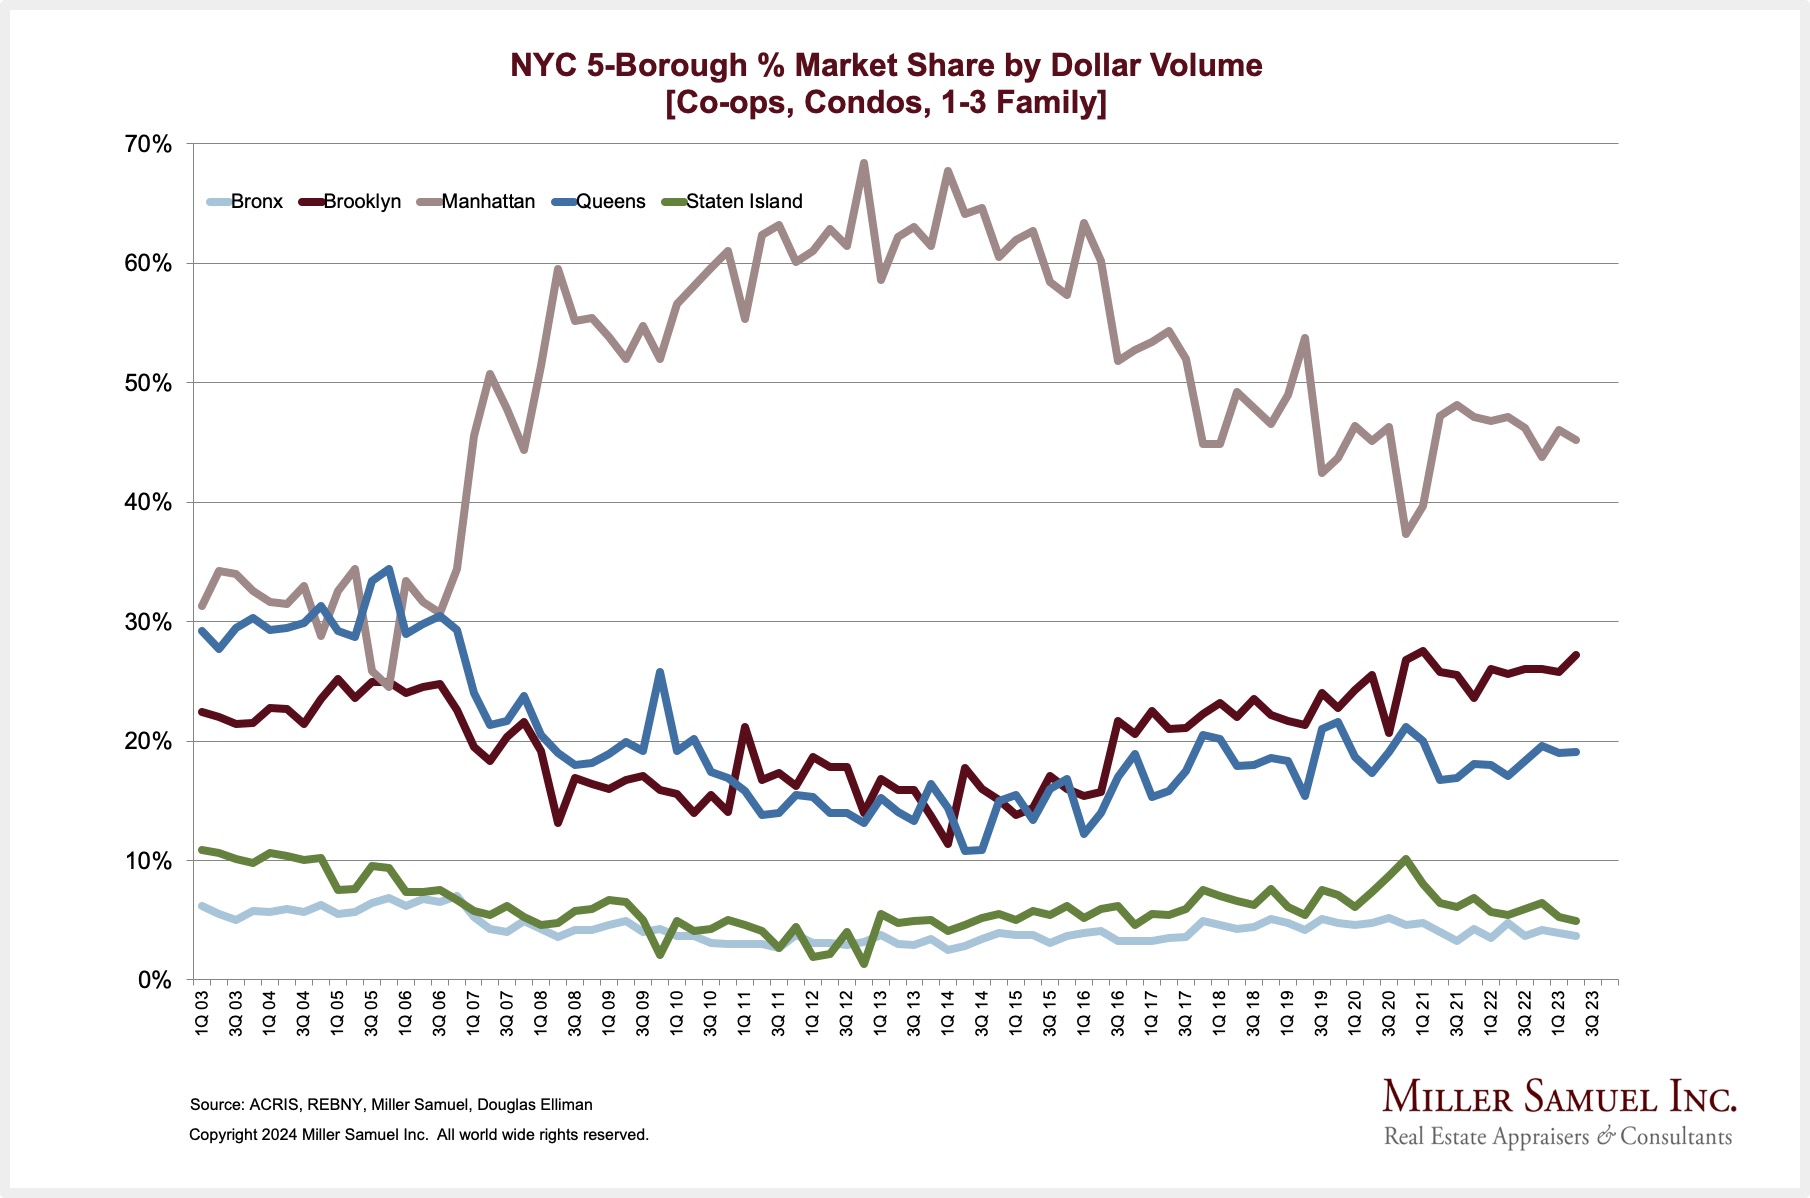
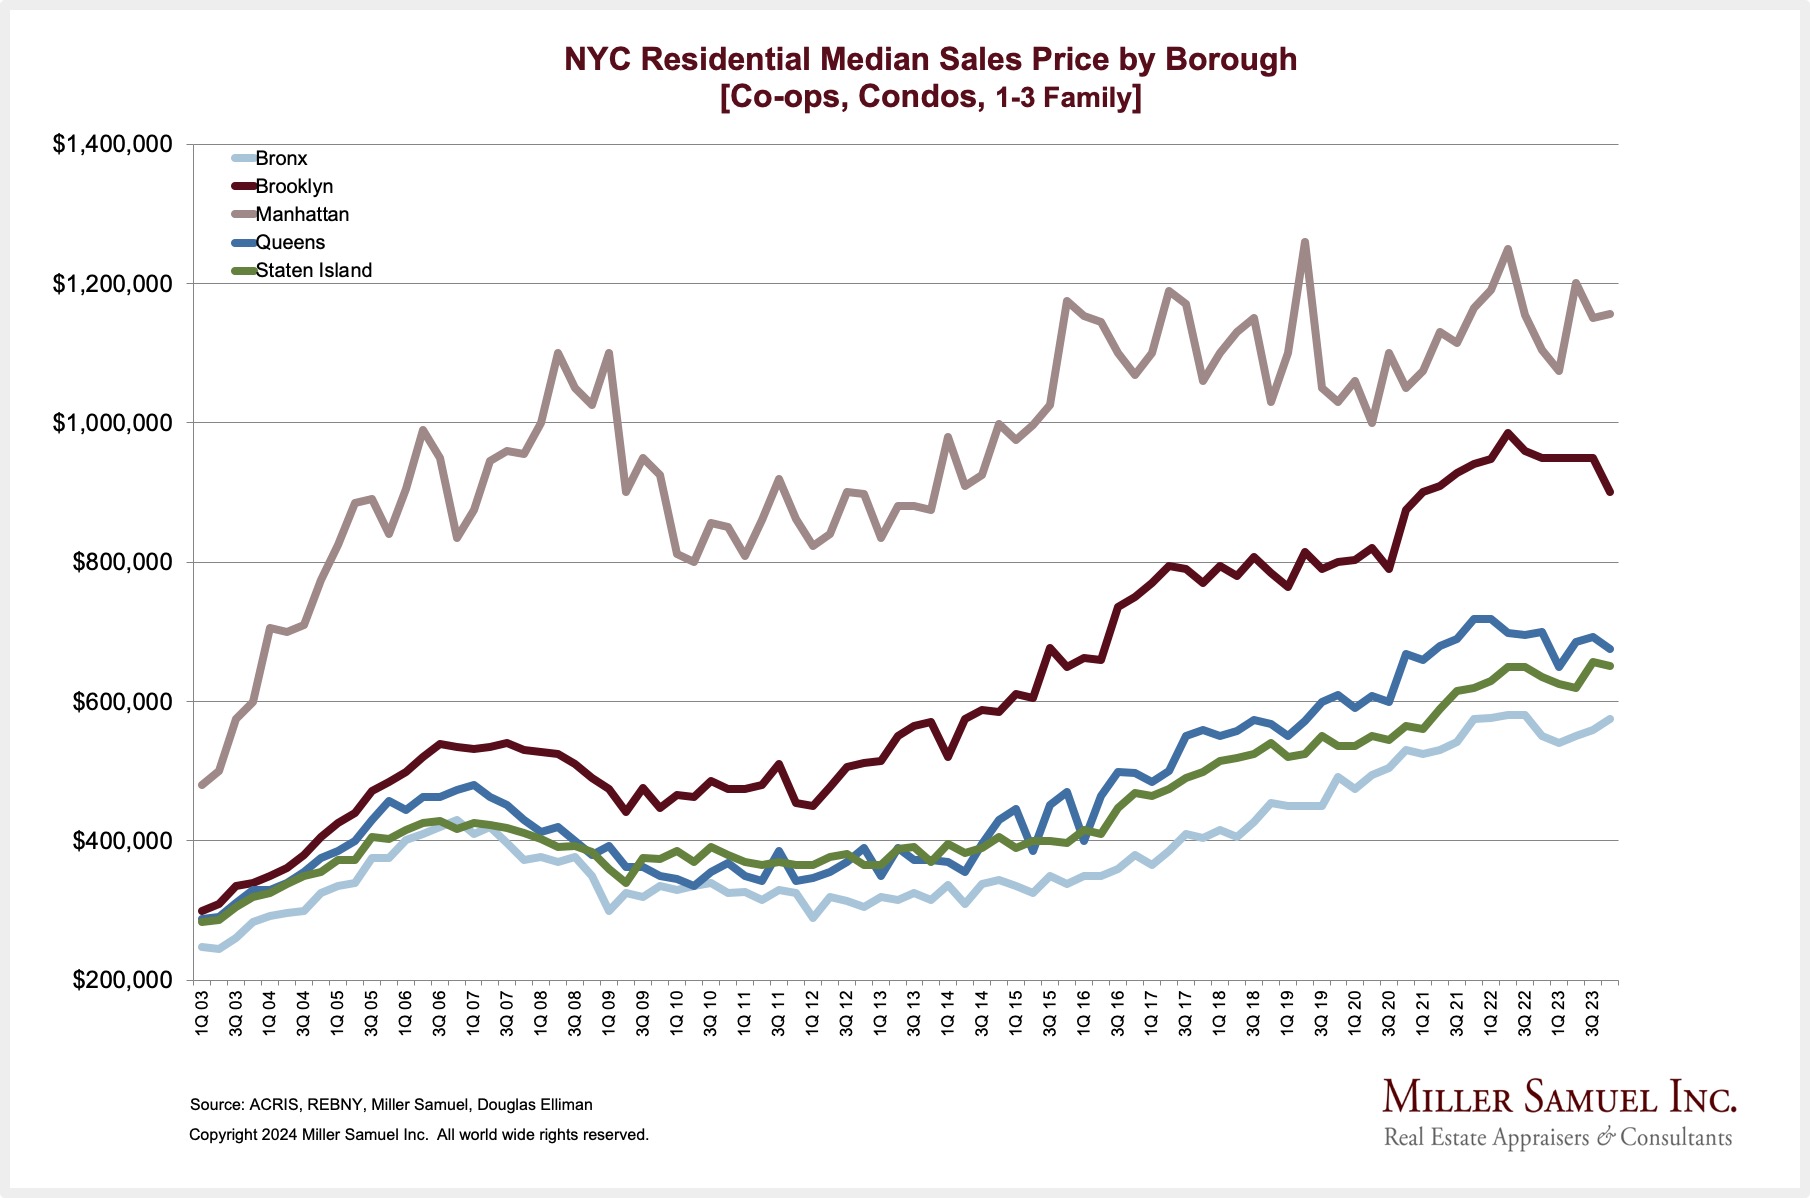
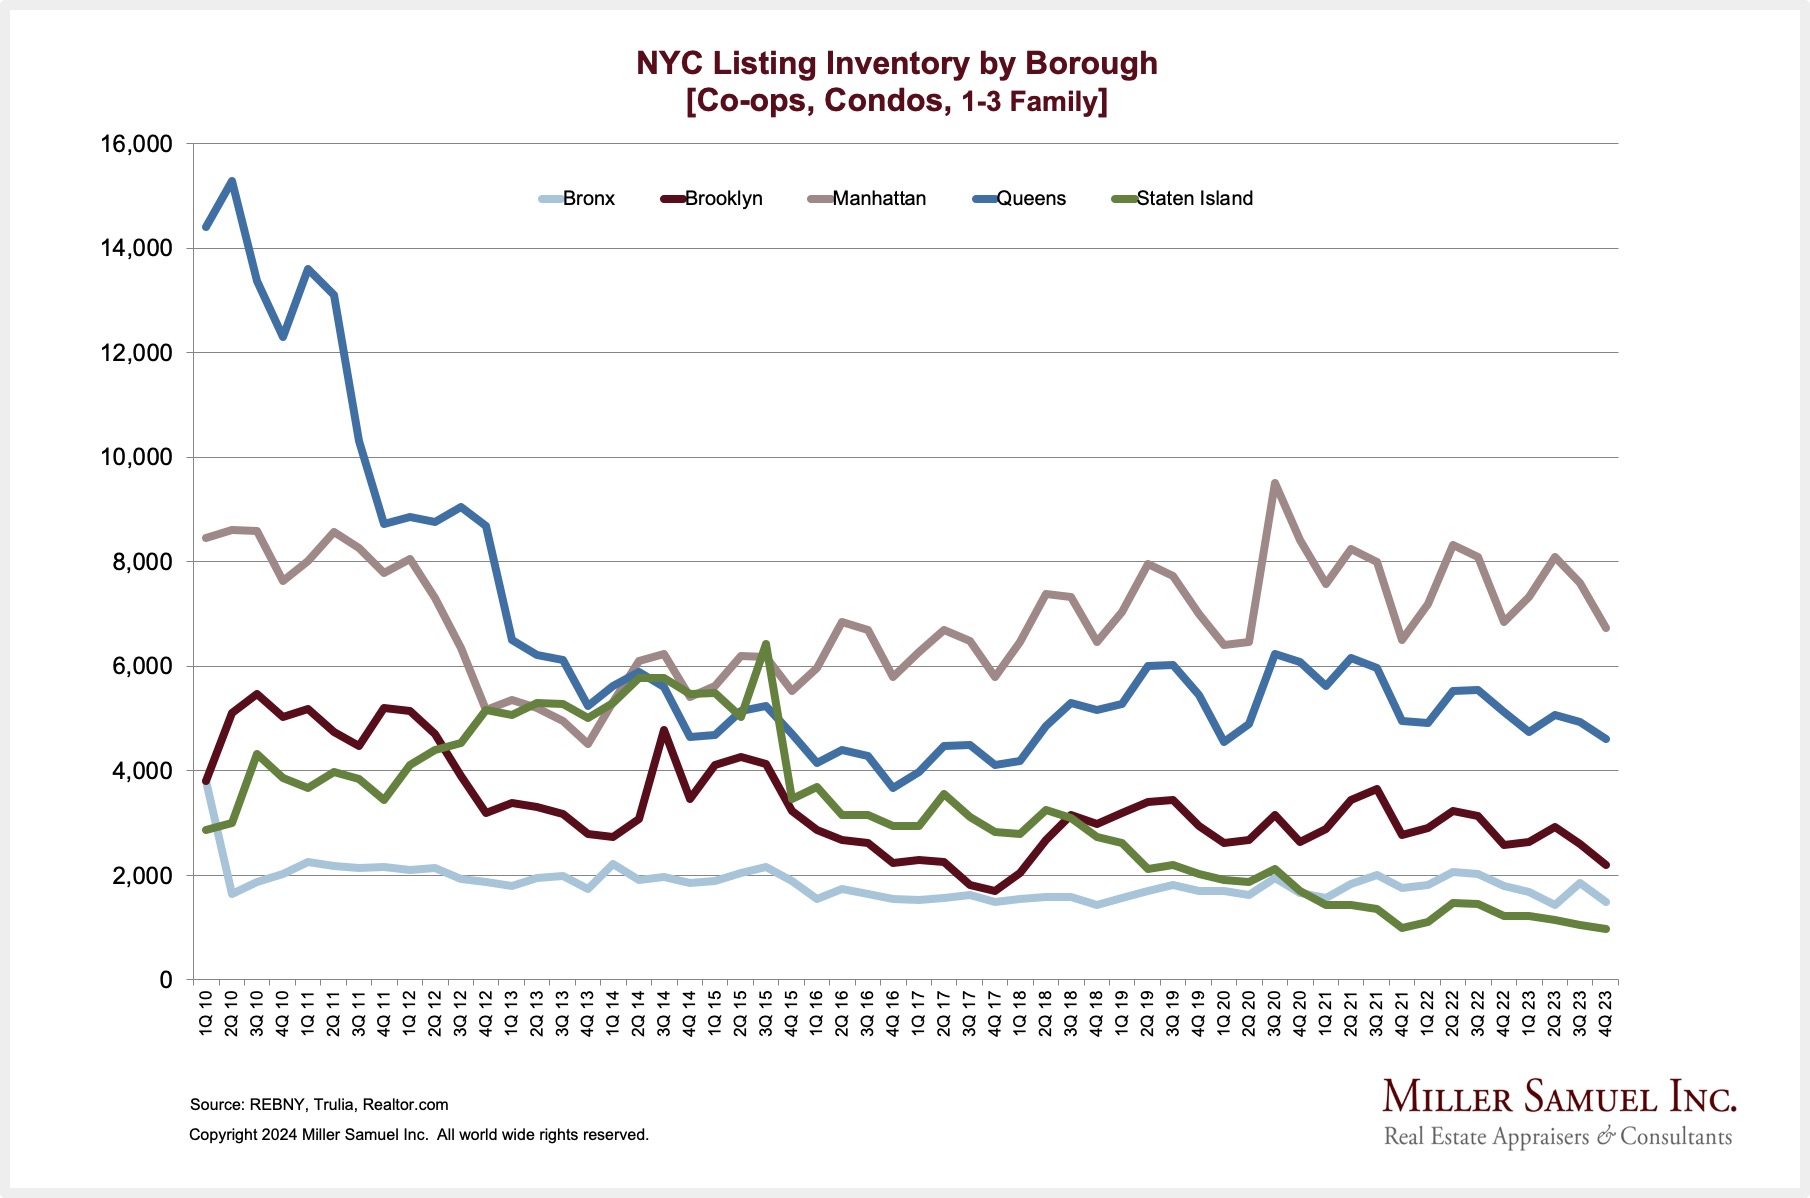
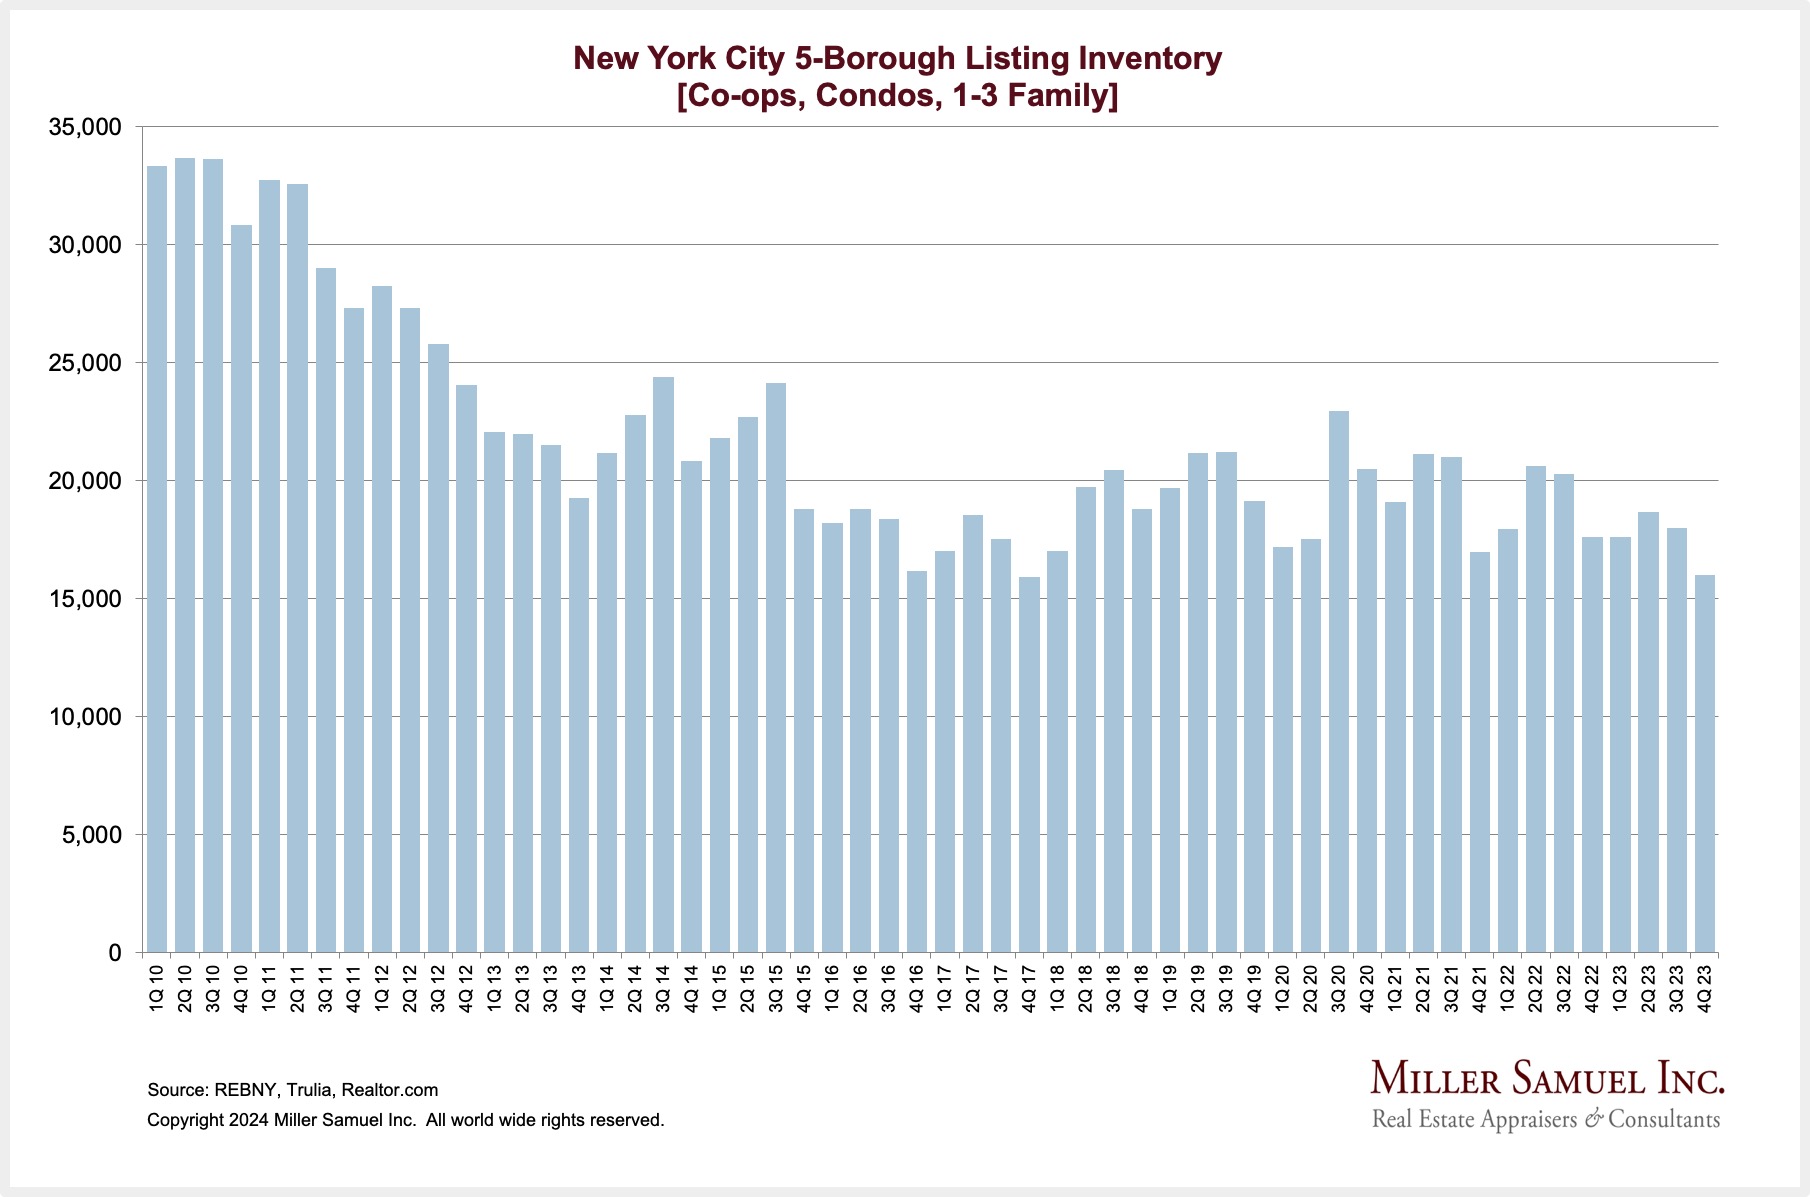
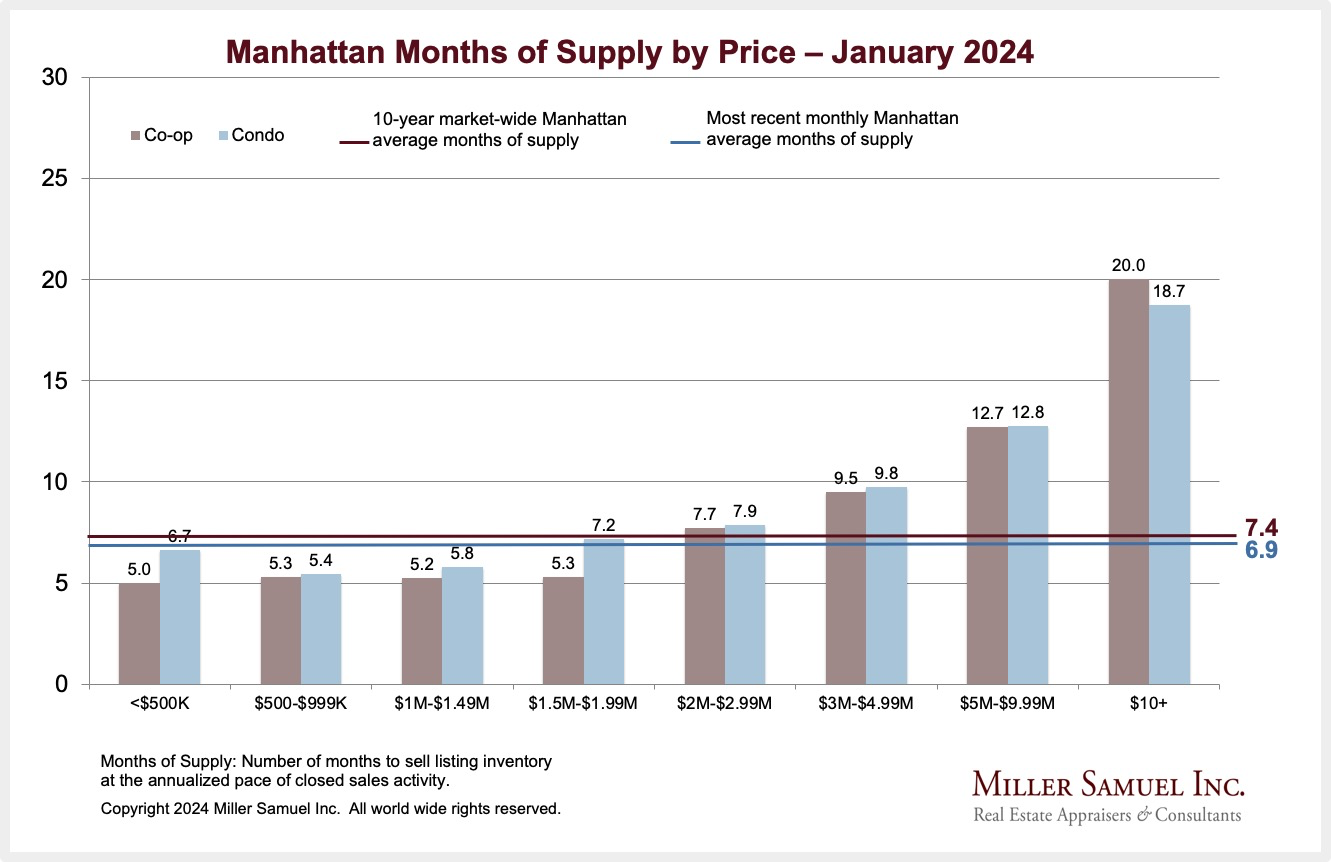
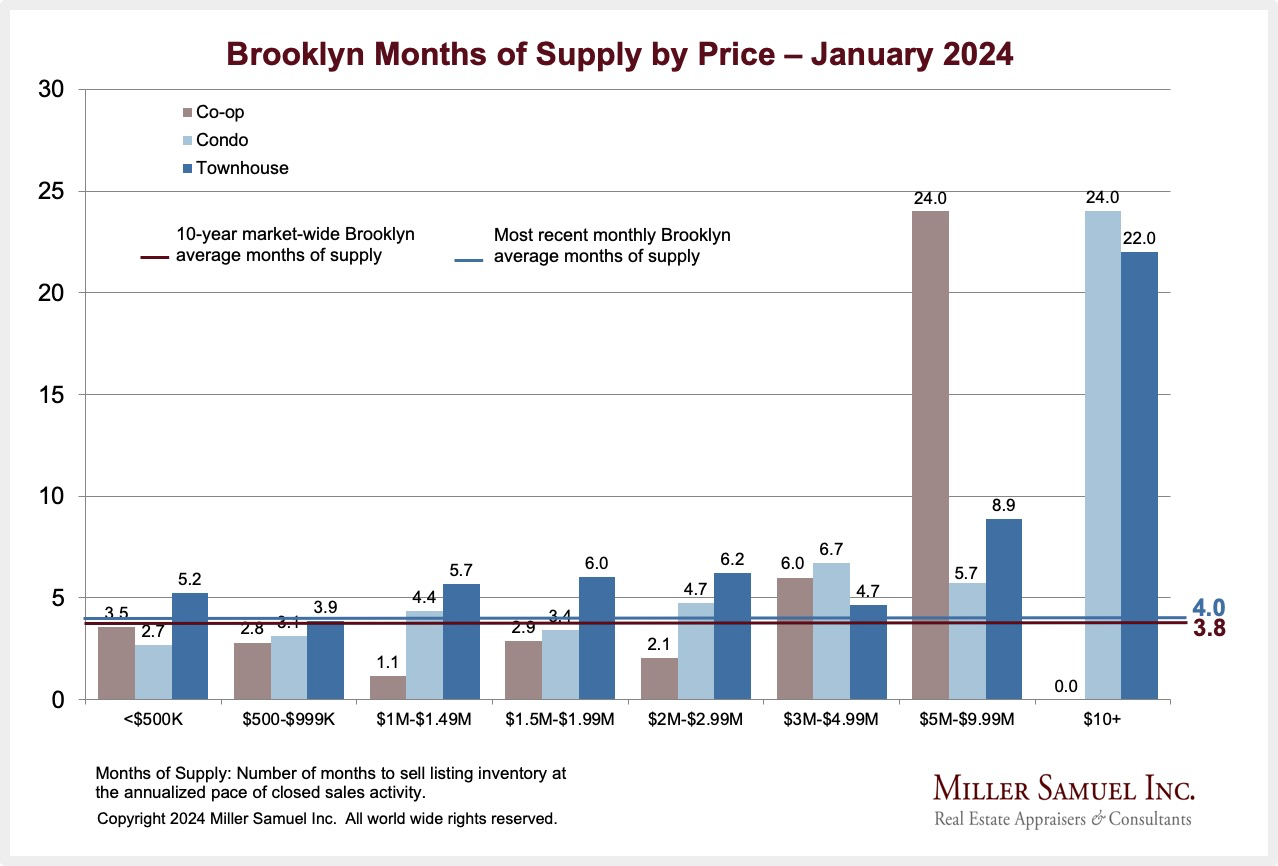
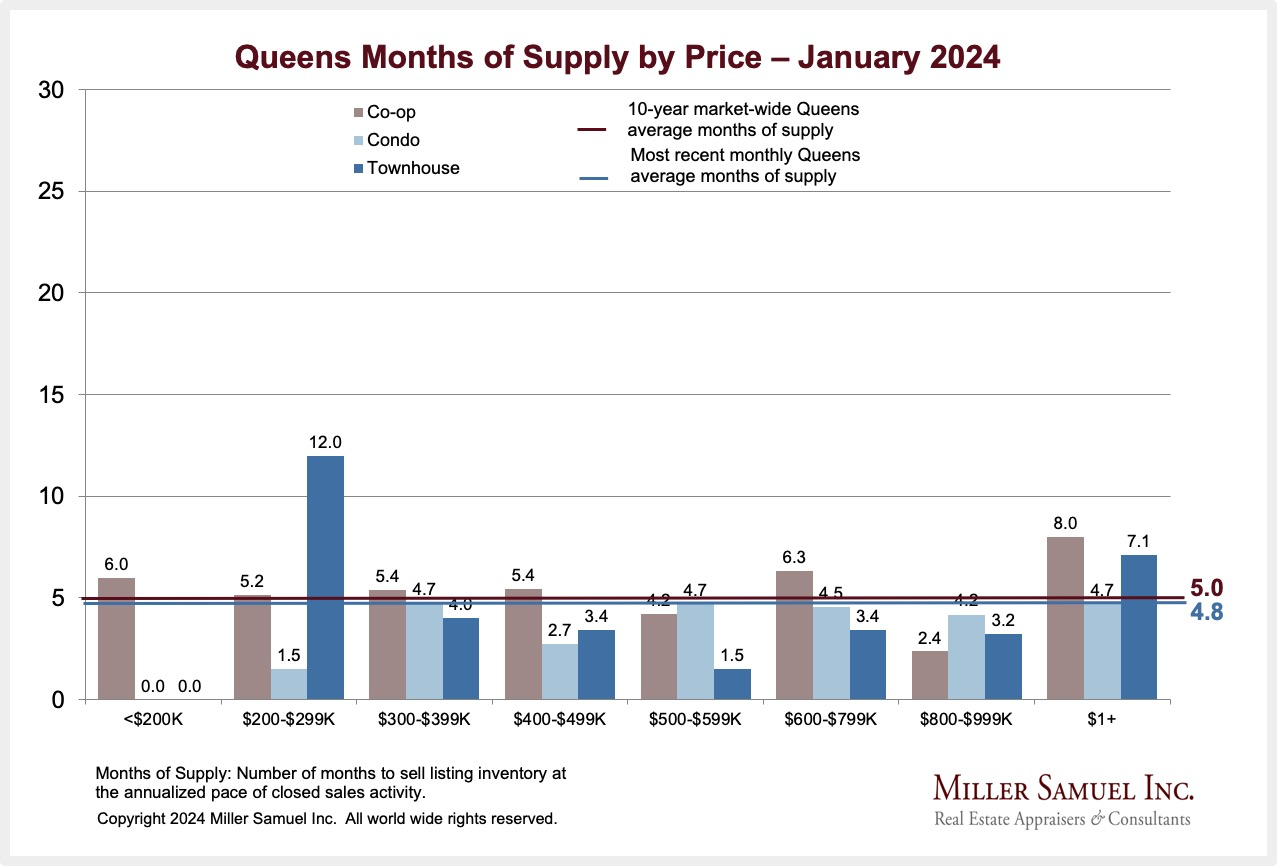
Looking at NYC’s 5-Boros, It Was A Slower, More Expensive Year For Housing
While we publish reports for Manhattan, Brooklyn, and Queens, I also independently track Staten Island and The Bronx. Here are a series of charts for some context:
It’s EXP’s Turn To Get Caught For Sexual Assault

Inappropriate behavior is not exclusive to NAR these days. New York Times’ Debra Kamin broke another story with a sexual harassment theme – New York Asks Realty Company to Investigate Sexual Assault Allegations. This time it’s with EXP, a 90,000-agent firm that began in 2009 and now is a $2 Billion company. She previously wrote about EXP’s behavior in 2023 – Women at Fast-Growing Realty Firm Say They Were Drugged and Assaulted.
But allegations of sexual assault, often coupled with reports of the use of GHB — the “date rape drug” that causes loss of consciousness and memory — persist at the brokerage. As recently as May, another female broker for the company said she blacked out while attending an eXp conference in Orlando, and when she regained consciousness, she was in a strange hotel bed and a real estate photographer she had met that evening was on top of her, penetrating her with her hands around her neck.
New York Times
The EXP agents “participate in a unique payment structure where agents recruit other agents and then take a cut of their earnings. Those who recruit the most are revered.” This business structure reminds me of the multi-level marketing (MLM) poster child, AMWAY.
I remember a bunch of guys in my college dorm sophomore year bought into AMWAY – my dorm roommate told me he didn’t invite me to the meeting because “I was too rational.” Everyone lost their shirt, and the guy who started the group had to drop out for a semester because he lost his tuition. Gotta love being rational.
These national real estate organizations need some severe public relations help. I’m waiting for the next shoe to drop.
New Signed Contracts Remain Low But Starting To Climb Year Over Year Across Many Regions
Douglas Elliman released our new signed contract data for three regions: NYC Metro, Florida, and Southern California. Here are the reports and sample charts of one market.
Elliman Report: January 2024 New York New Signed Contracts

Elliman Report: January 2024 Florida New Signed Contracts

Elliman Report: January 2024 California New Signed Contracts

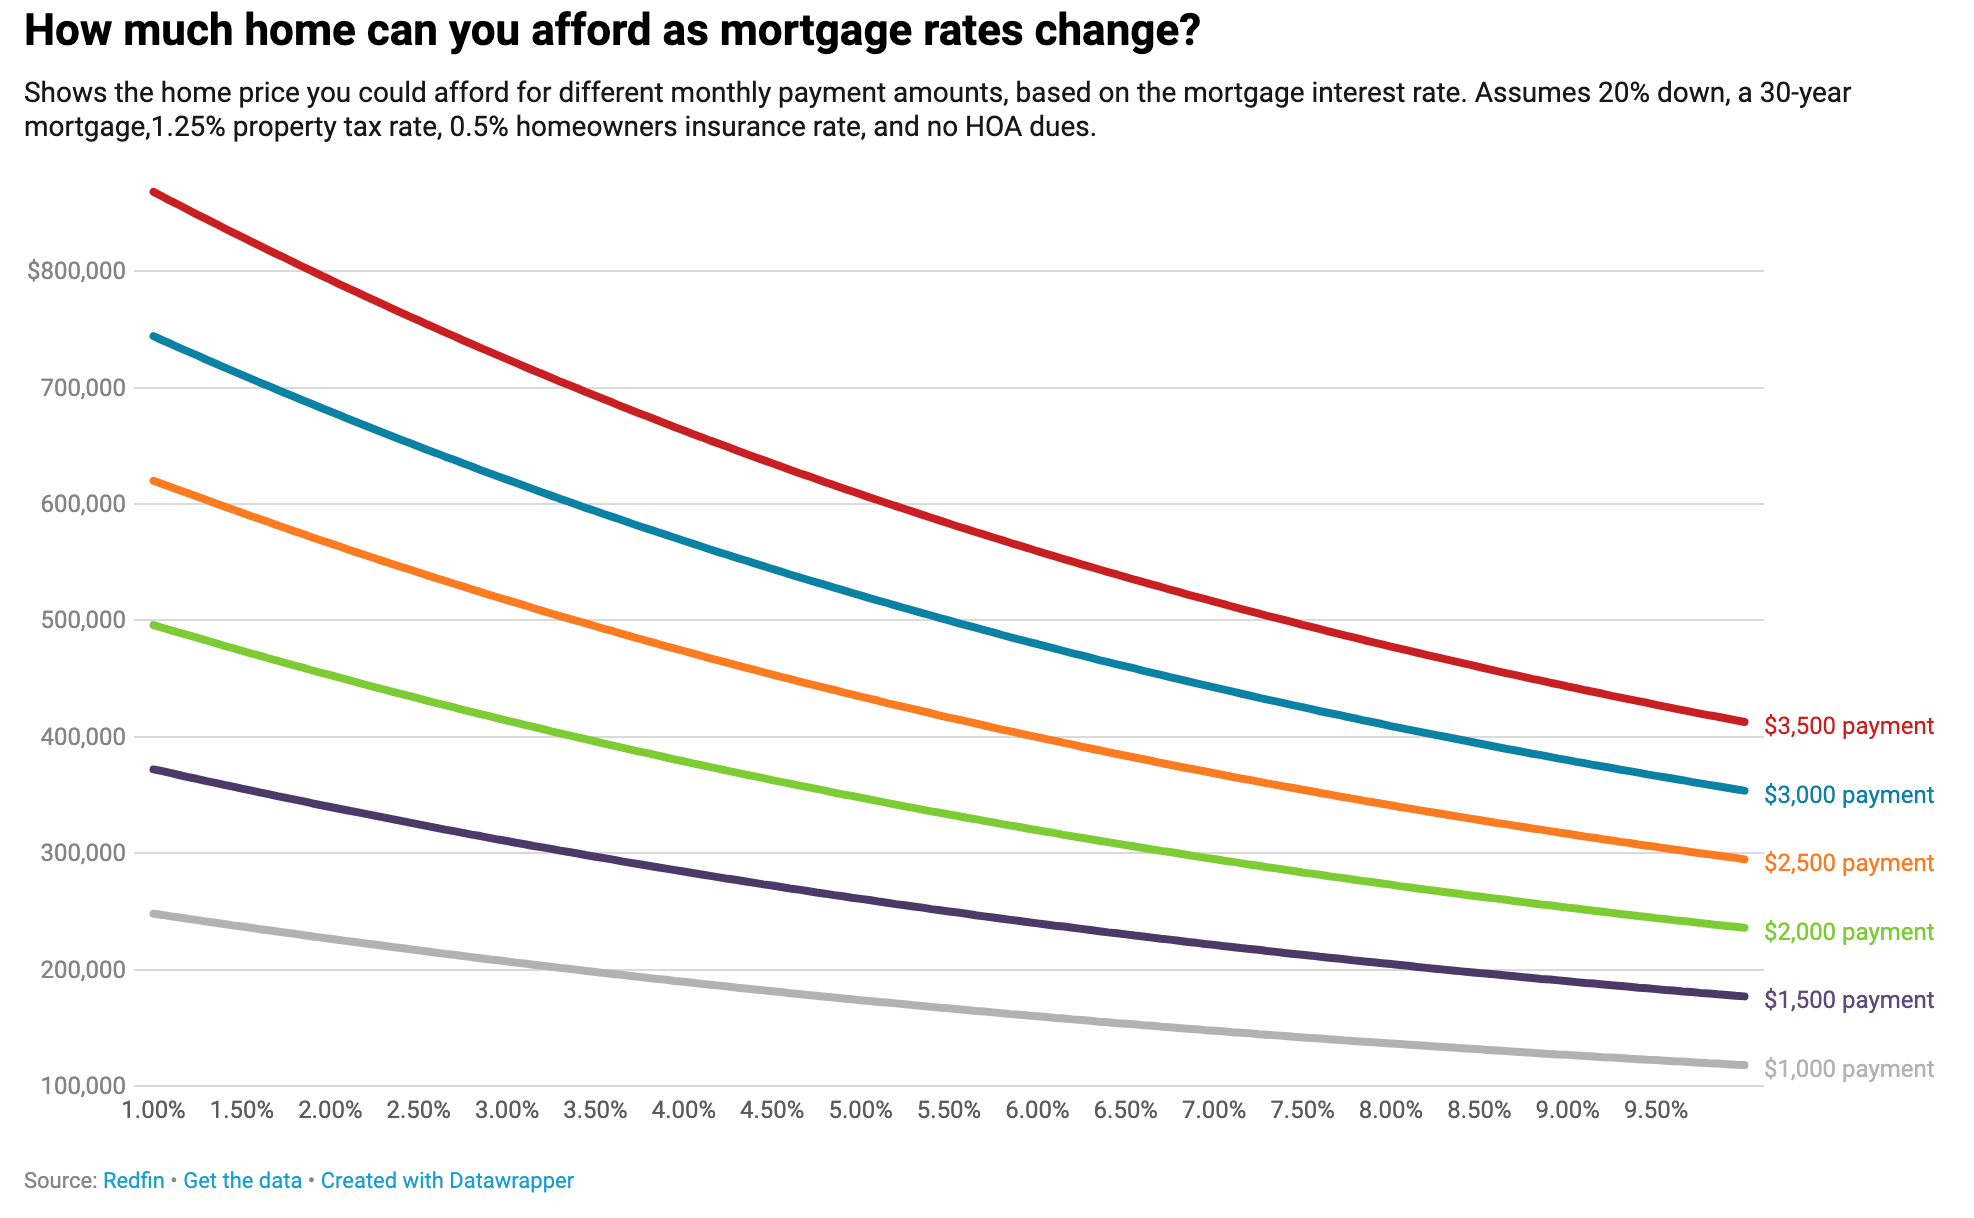
“Date The Rate” As Deceptive Advertising

There is an essential article to read by Inman News CEO Jillayne Schlicke: Does your ‘date-the-rate’ advice constitute deceptive advertising? I’ve read her musings for nearly twenty years and first met her a few decades ago when I faithfully went to the two Inman Connect conferences per year held on the East and West coasts.
- “Buy a home now, and I can refinance you when we go into a recession and rates go down.”
- “Buy a home now because when rates go down, there will be bidding wars, multiple offers and home prices will only go higher.”
- “Buy a home now using an Adjustable-Rate Mortgage, and when rates go down, I can refinance you out of that ARM loan.
- “Date the rate, marry the house!”
Got to Inman News for the full article:
Does your ‘date-the-rate’ advice constitute deceptive advertising? [Inman]
Manhattan Townhouse Decade Report Shows Rising Prices, Steady Sales
We publish an annual Manhattan townhouse report with a ten-year moving window for this small luxury submarket. It dropped today.
Elliman Report: 2014-2023 Manhattan Townhouse Sales
“The market ended the year with record prices, elevated sales, and listing inventory below pre-pandemic levels.”
- – Median and average sales prices rose to new highs in twenty-seven years of tracking
- – Listing inventory fell year over year for the first time in three years
- – Sales fell annually for the sixth time in seven years
- – Luxury listings fell year over year for the second straight year
- – Single family sales slipped year over year for the second time as price trend indicators fell
- – Two family price trend indicators surged year over year as sales declined for the second time
- – Three-five family price trend indicators surged year over year as sales declined for the first time in three years
- – The average sales sizes of two and three to five-family houses were the largest on record
- – The market share of townhouse sales as compared to total residential apartment sales remained just above two percent


Lots Of Unnecessary NAR Fees Persist
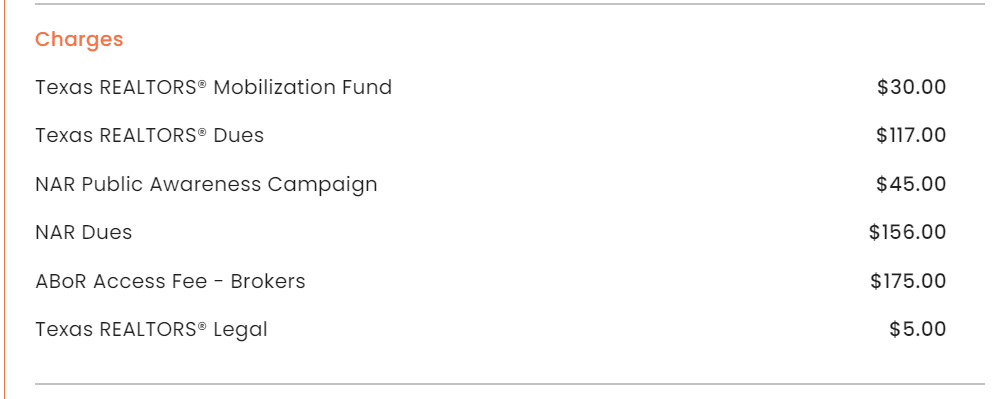
An appraisal colleague from Texas shared the charges he incurs for simply accessing the MLS.
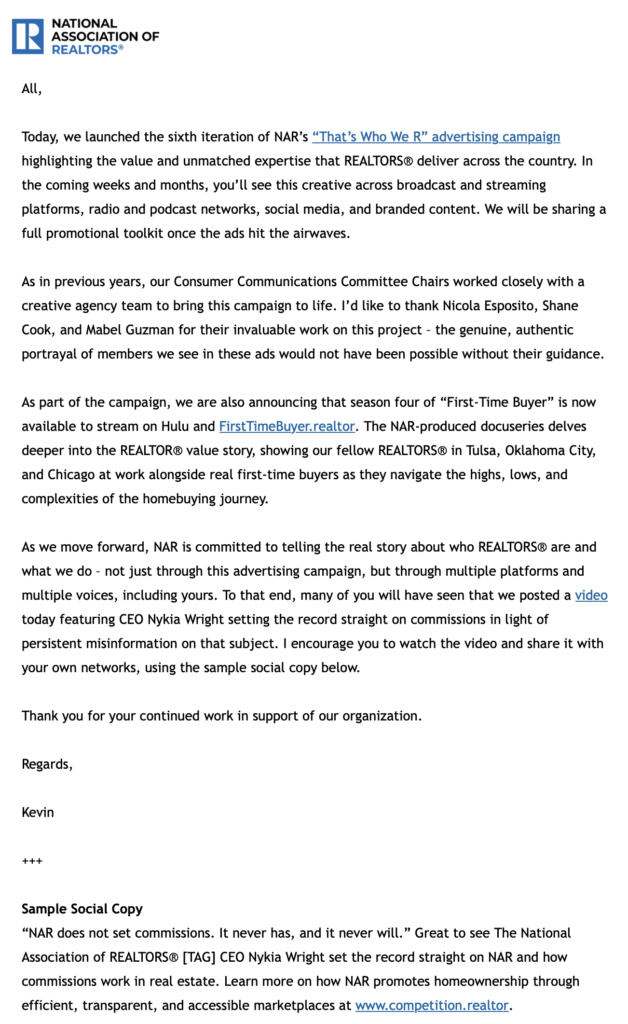
NAR shared this marketing campaign that they want their members to push. NAR has an ongoing multi-year “First-time buyer” marketing effort. He is offended as a dues-paying member to be forced to pay for NAR’s bad behavior.
There Are More Cash Buyers (Non-Investors) Than You Think
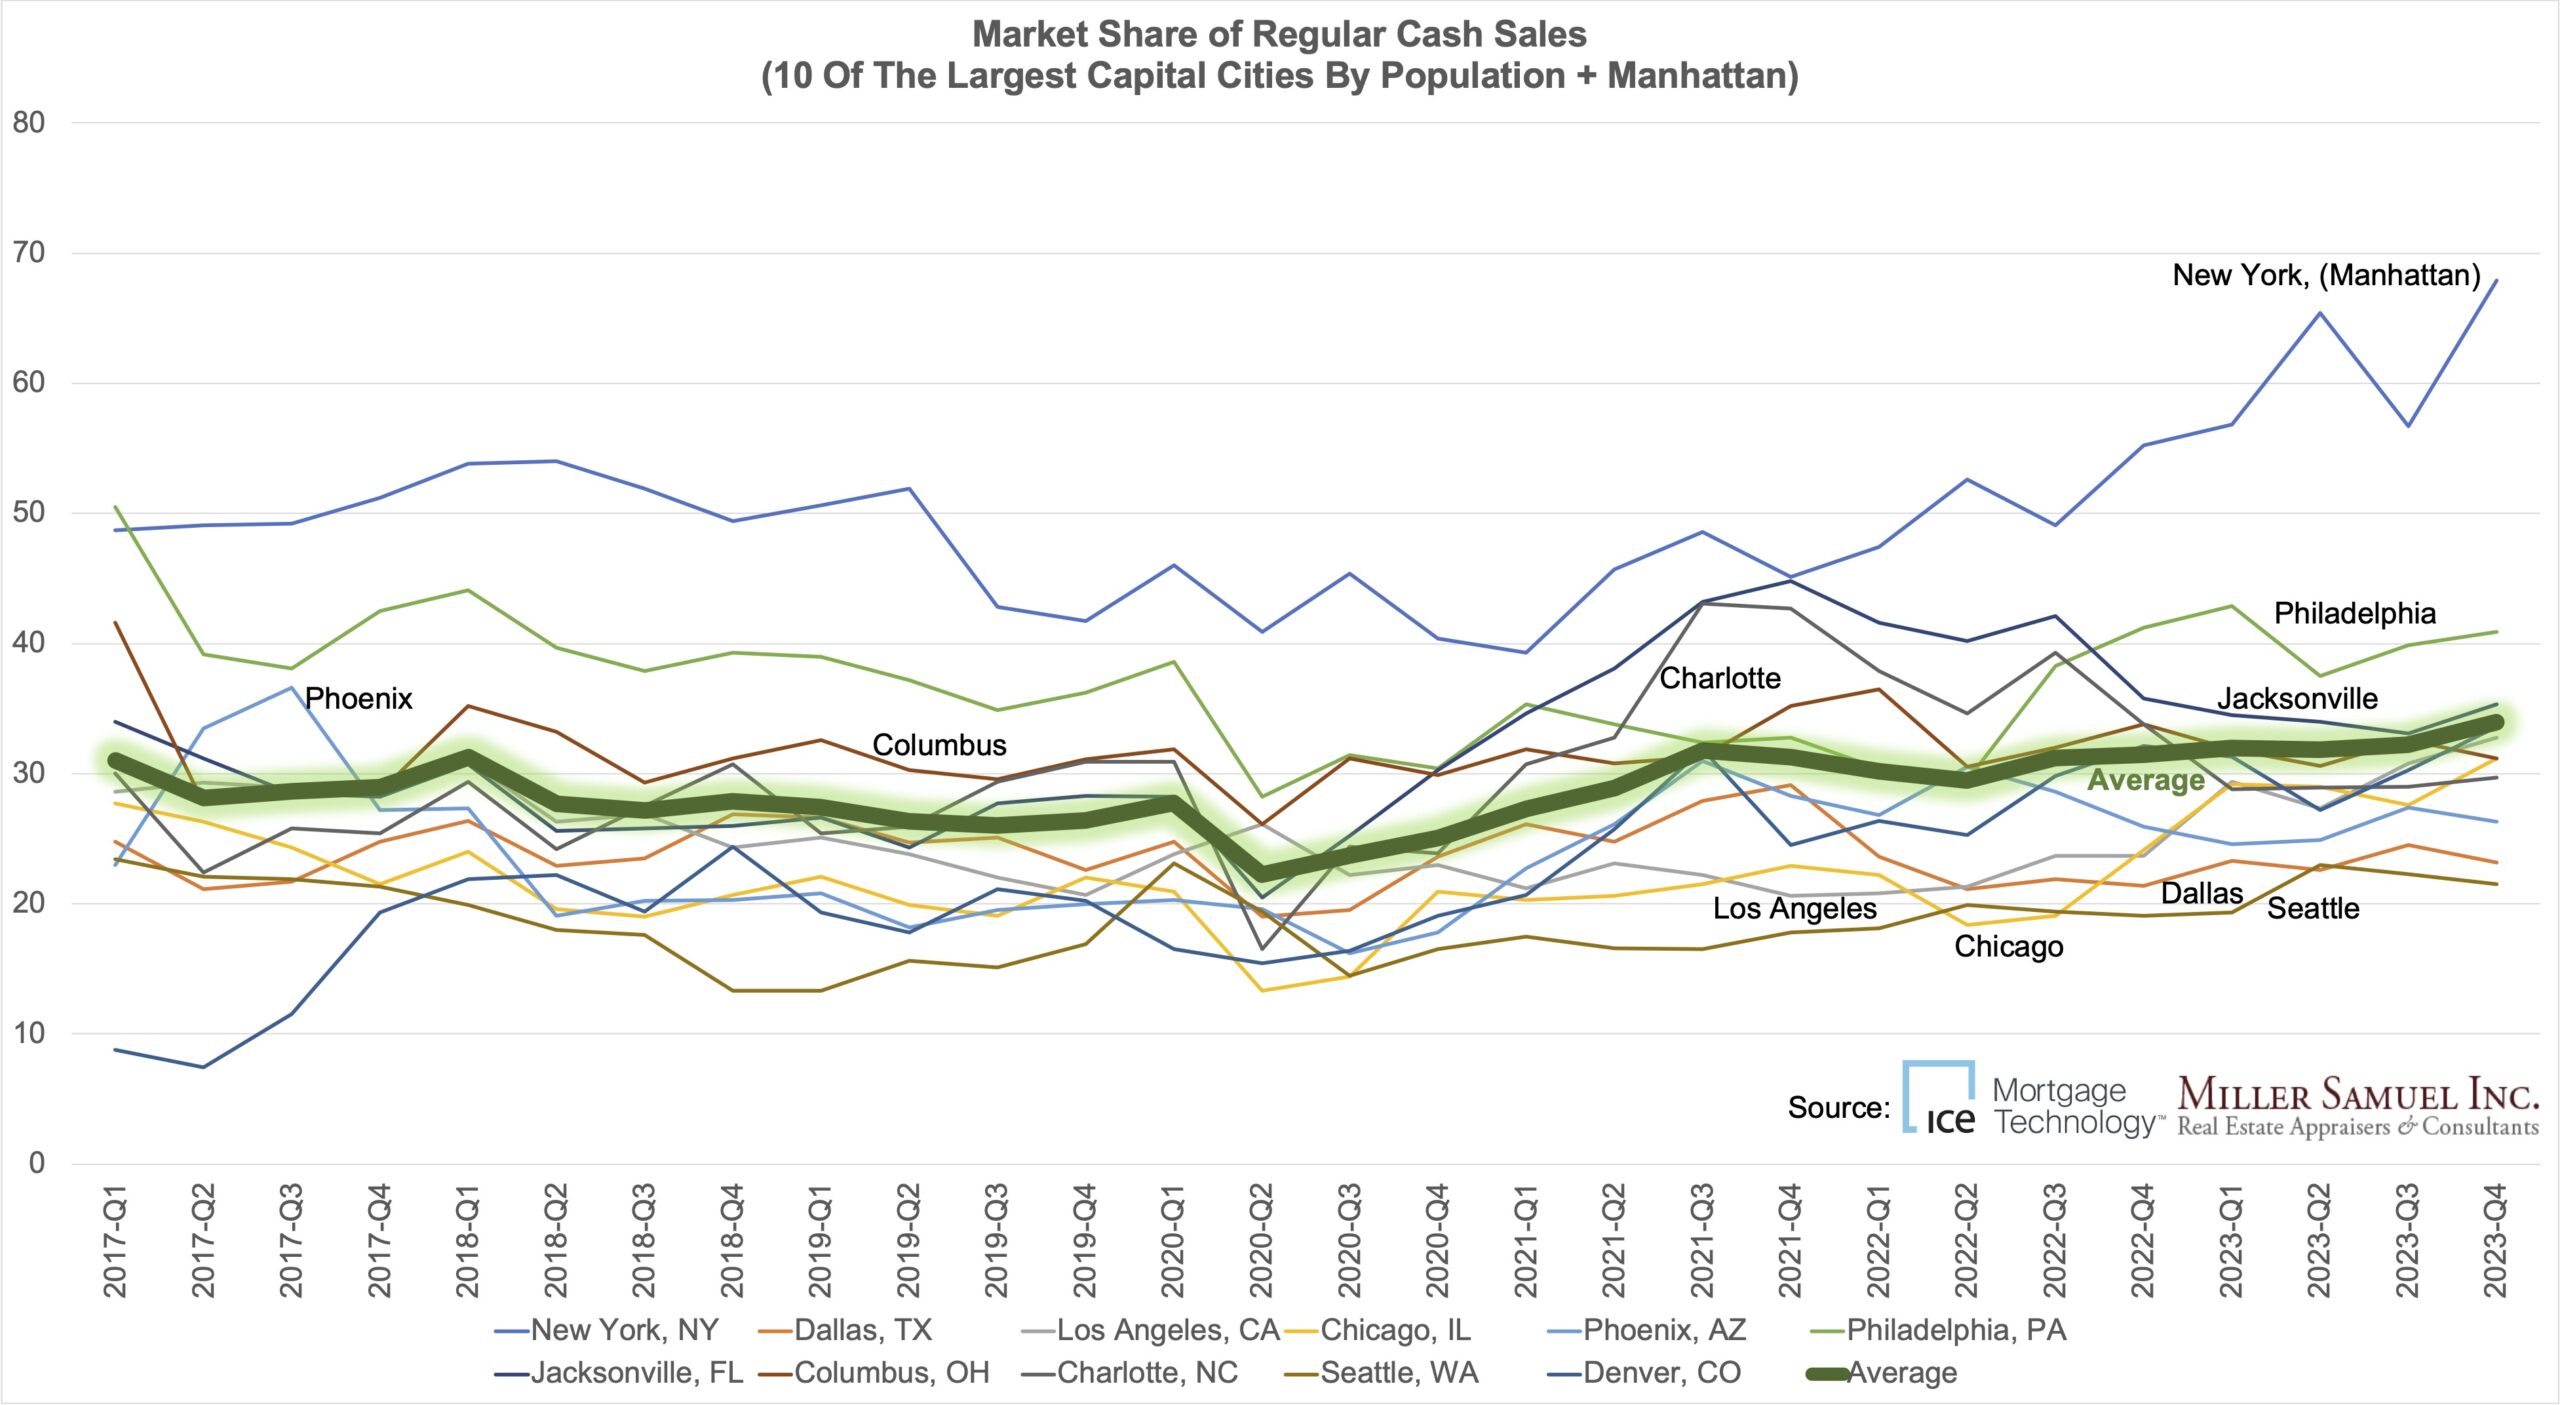
ICE Mortgage Technology has generously provided access to HomePrice Trends® so I can share the most up-to-date housing market trends across the U.S.
Now, my Housing Notes readers can send me chart requests, and I will try to create one that echoes it (If it interests me – remember, I make the rules here). So think big and send your chart ideas.
Late last year, Manhattan reached a record level of cash sales (68%) in the decade we’ve been tracking it. Higher mortgage rates drove cash buyers higher in Manhattan. I thought it would be interesting to look at other cities across the U.S. and picked ten state capitals with some of the highest populations. By averaging the results, cash buyers compose roughly 30% of “regular” sales (distressed investor sales are excluded).
This result begs the question: “How do so many have so much cash?” I’ll bet a large chunk of cash buyers (non-investors) are empty-nesters, buying with the equity left over from their sale to downsize (speaking as an empty-nester).
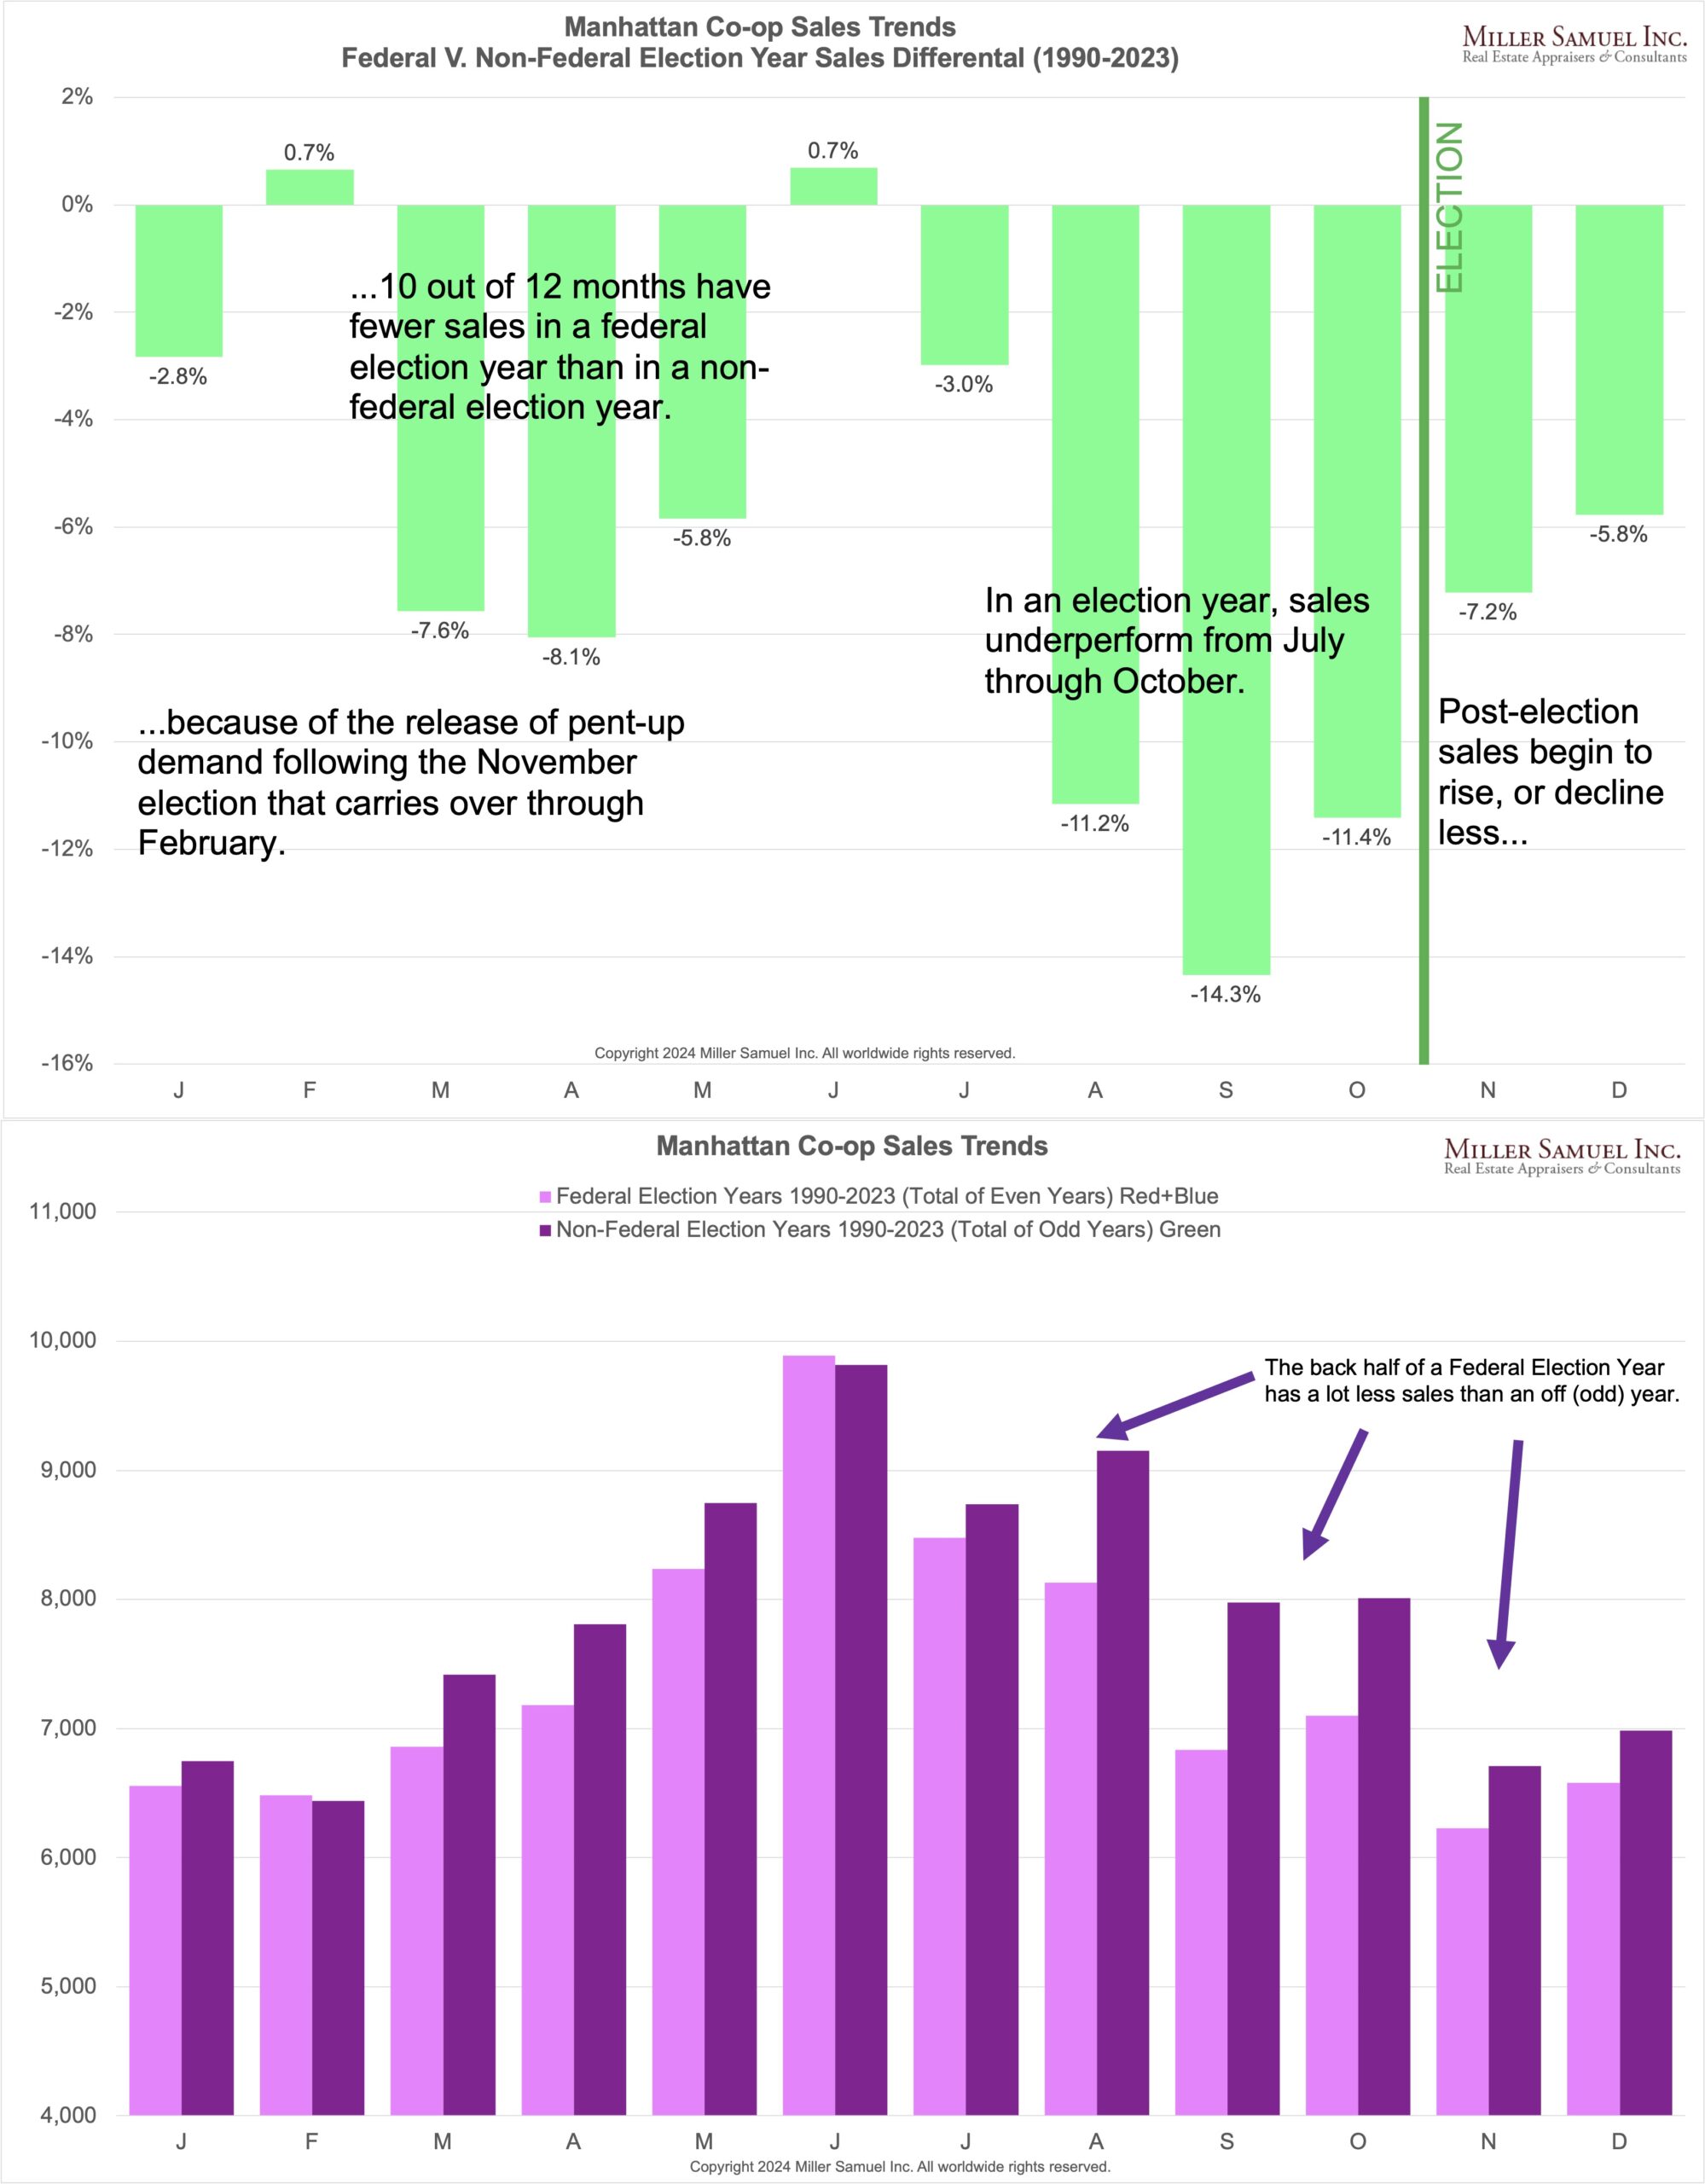
Measuring The Impact Of An Election – Fewer Sales
I get a lot of questions about the impact of federal presidential elections and mid-terms on the housing market. I addressed this back in 2020 but decided to update it. I selected Manhattan co-op sales because, unlike Manhattan condos, co-ops outnumber condos 3:1, and they don’t see a lot of new development activity where condo projects enter the market are usually based on when construction is nearly complete rather than by market forces.
I identified the sales by month from 1990 through 2023, adding up the even years (federal election years) and then adding up the odd years and comparing them. The first chart illustrates the significant decline in sales during a federal election year just before election day. Ten out of twelve months in an even year show fewer sales than in an odd year. The second chart shows the same impact in a different presentation style.
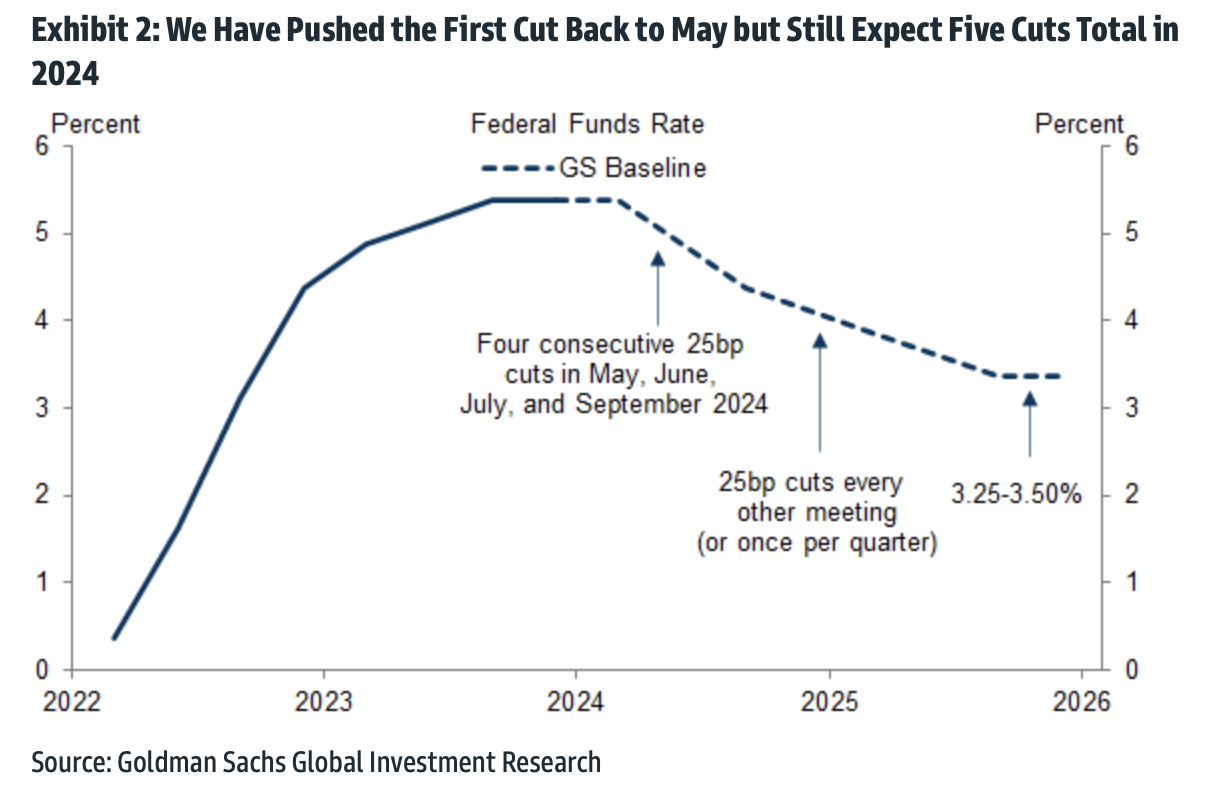
With the Fed policy pivot last December and the expectation of lower mortgage rates over the next two years and 2024 being an election year, the expected increase in sales could be more exaggerated in 2025 than in 2024.
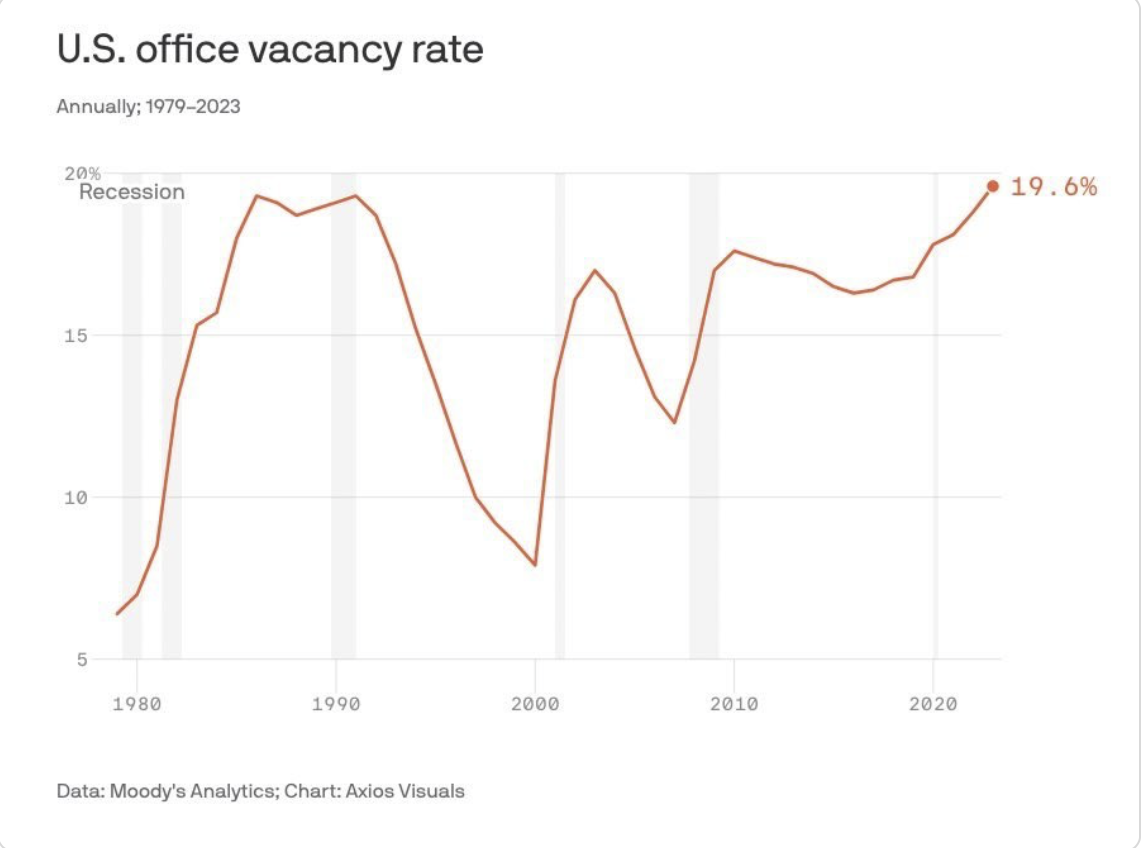
Highest & Best Newsletter: Mediocre Office Revival
You should sign up for this Florida newsletter I love – Highest & Best from Oshrat Carmiel, formerly of Bloomberg News…
This week’s post:
Mediocre Office Revival Second-class buildings are trending. The chic ones are full.

Can We Rebrand Realtor.com’s “Hotness Score?”
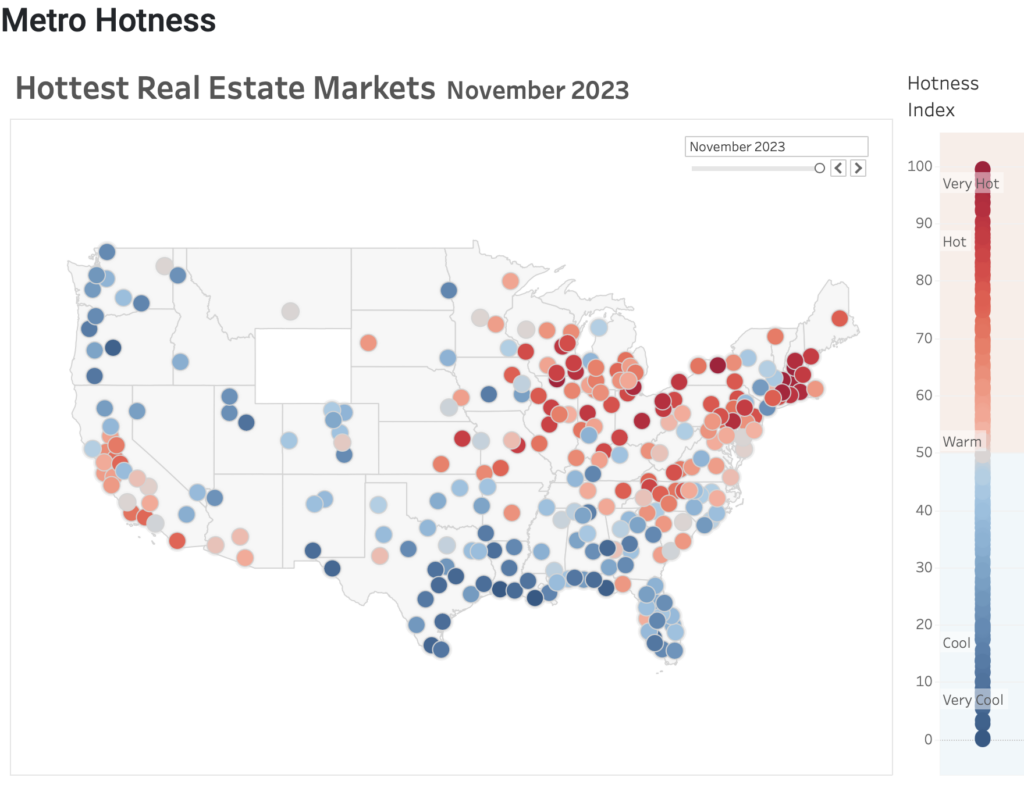
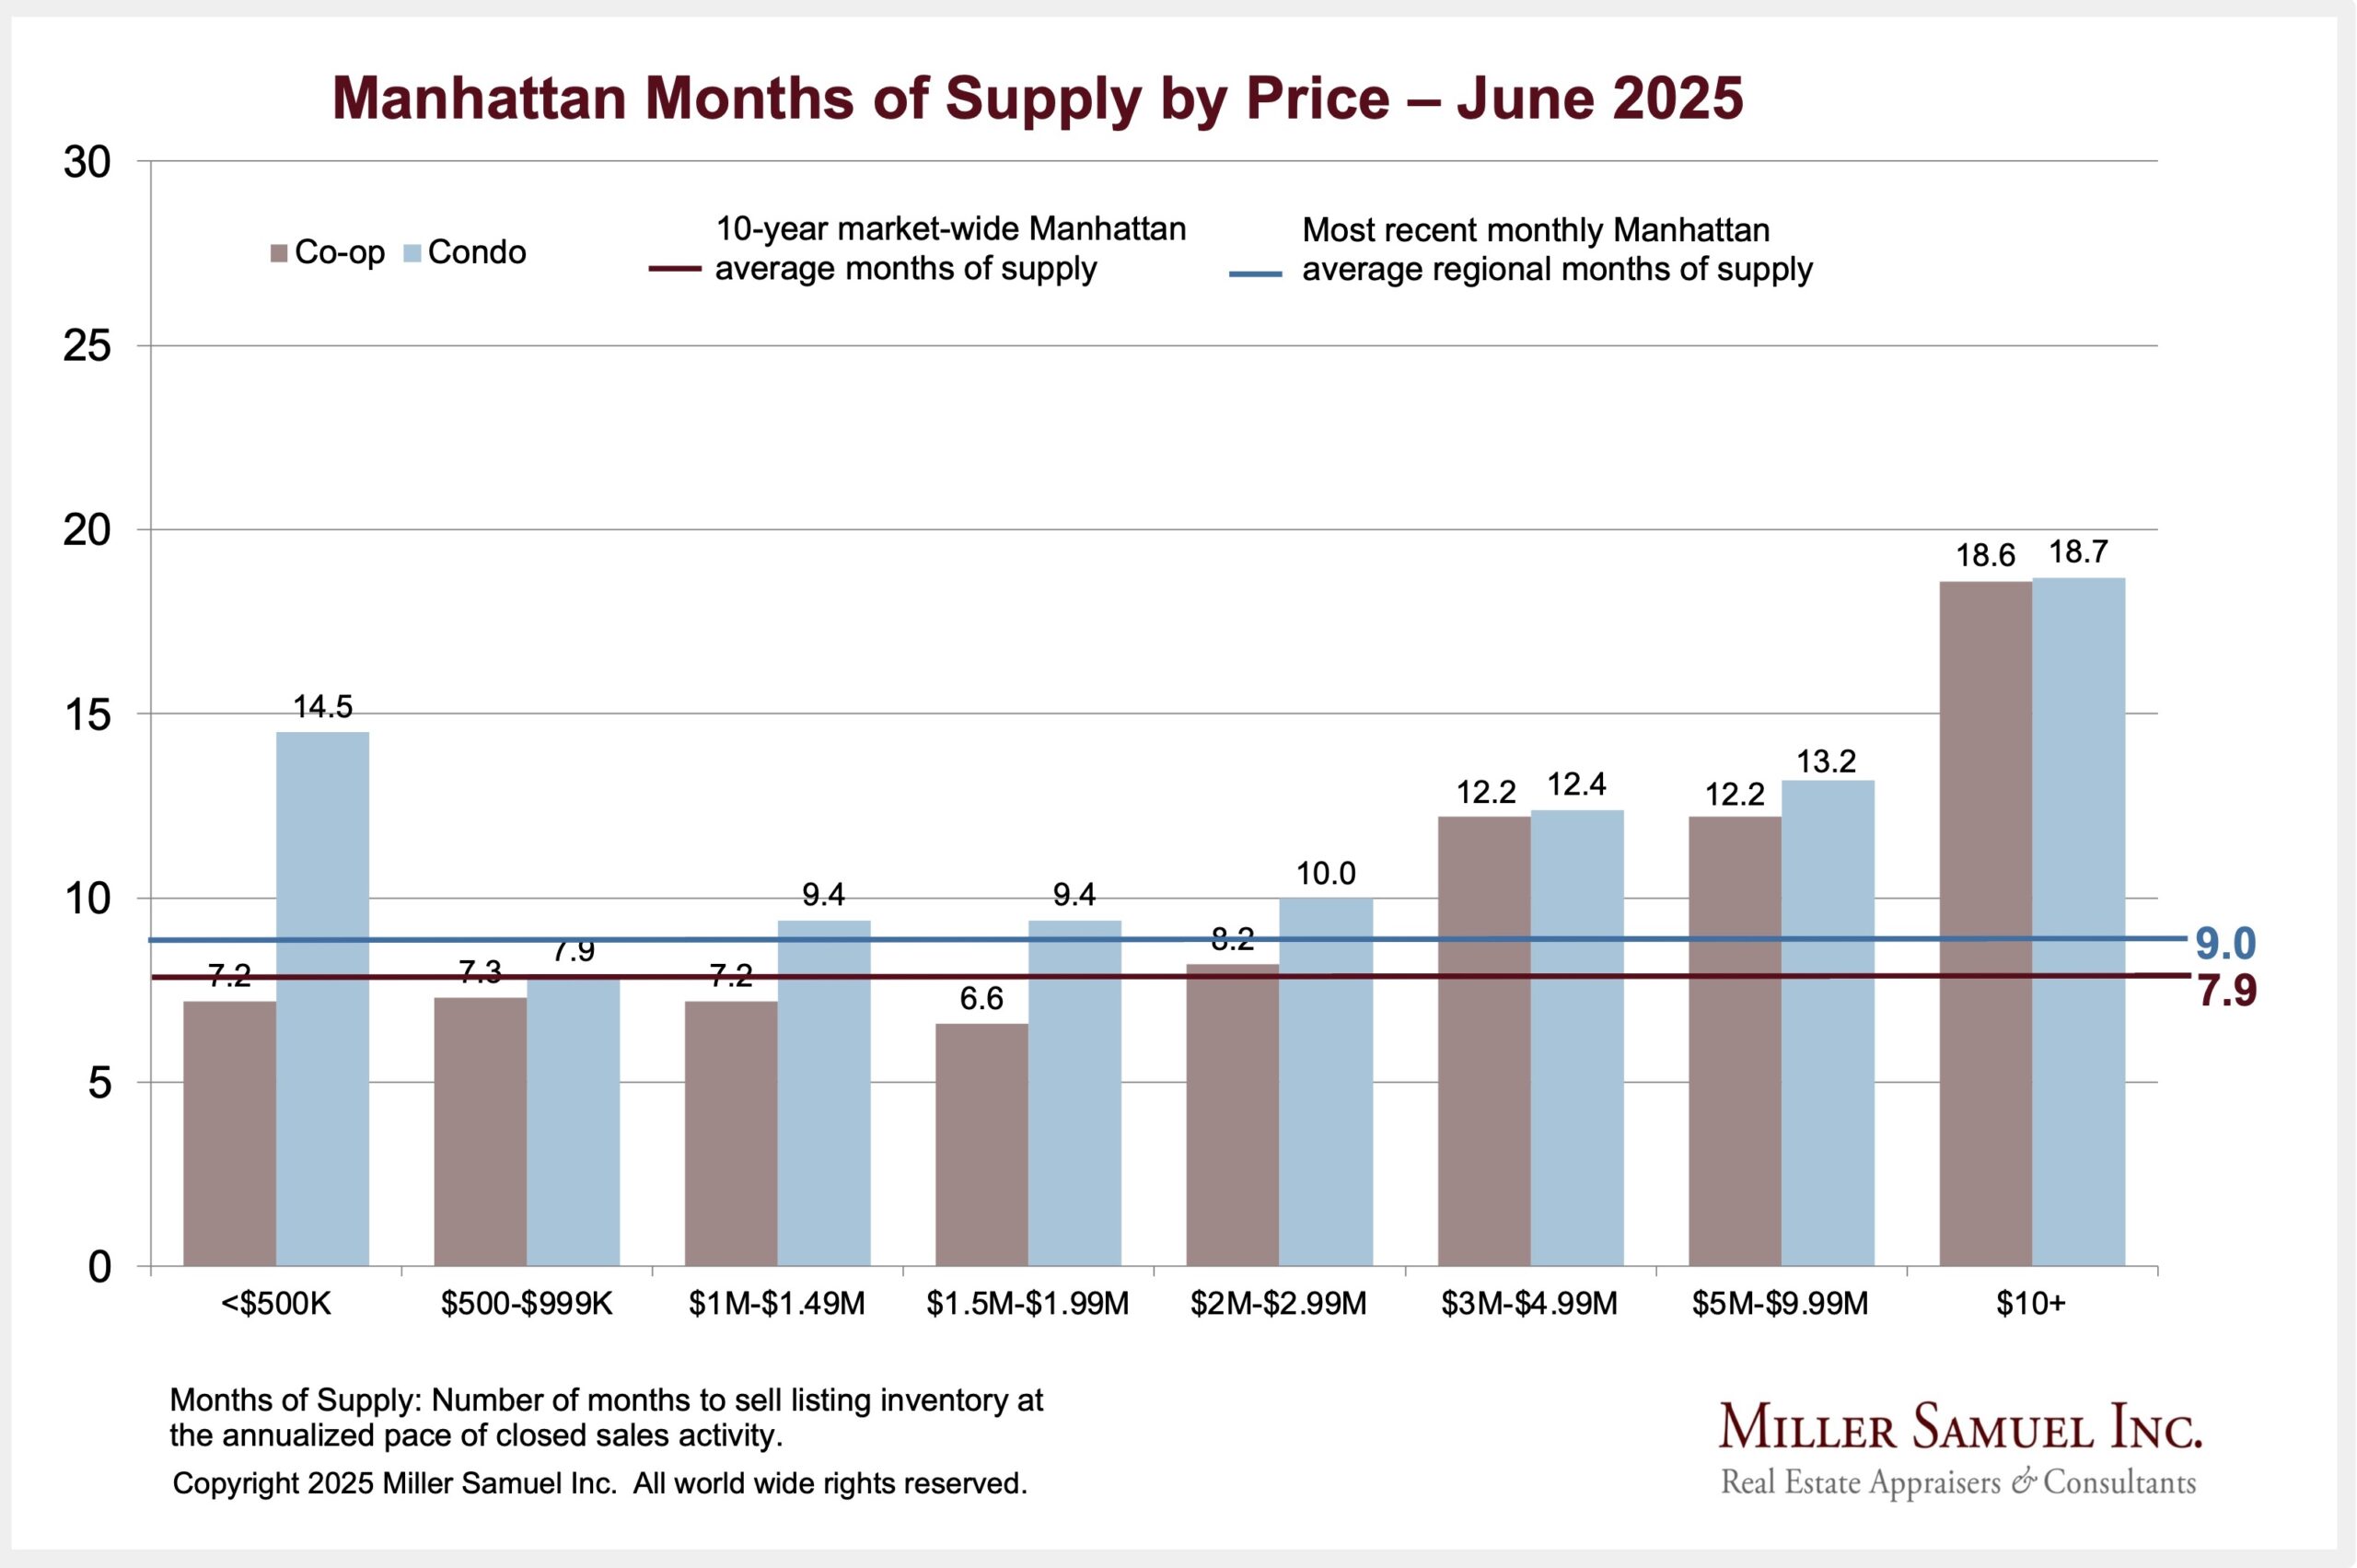
Realtor.com’s “Market Hotness Index” nomenclature reminds me of a middle-aged adult in the 1970s trying to say “groovy” in a sentence, thinking their teenage audience is impressed. Their study is essentially based on months of supply, which I define as the number of months to sell all inventory at the current sales rate.
Using this metric, markets written off as doomed, like California and the Northeast, seem hotter than formerly booming markets like Texas and Florida. Yet I see the Florida housing market as ramping up (I cover more than two dozen markets in Florida), and most markets are vibrant, or as one would say here…”nearly hot.”
My hot take? A local market analysis is a better way to examine a housing market. A “hotness” discussion doesn’t have its groove on.
70’s Peak Floorplan Layouts
Speaking of groove..the following layout “really ties the room together, man.” – Big Lebowski.

Getting Graphic
Favorite housing market charts of the week of our OWN making
Favorite housing market/economic charts of the week made by OTHERS
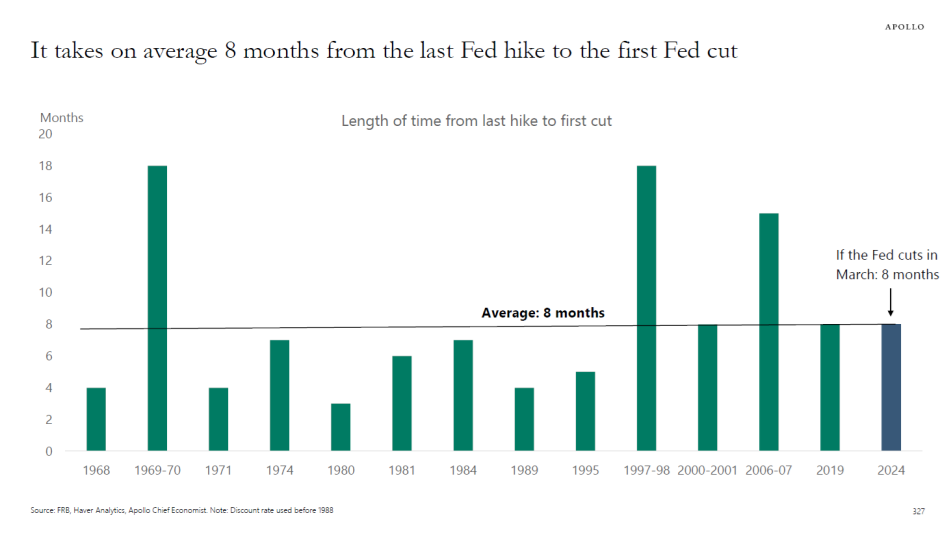
Apollo’s Torsten Slok‘s amazingly clear charts
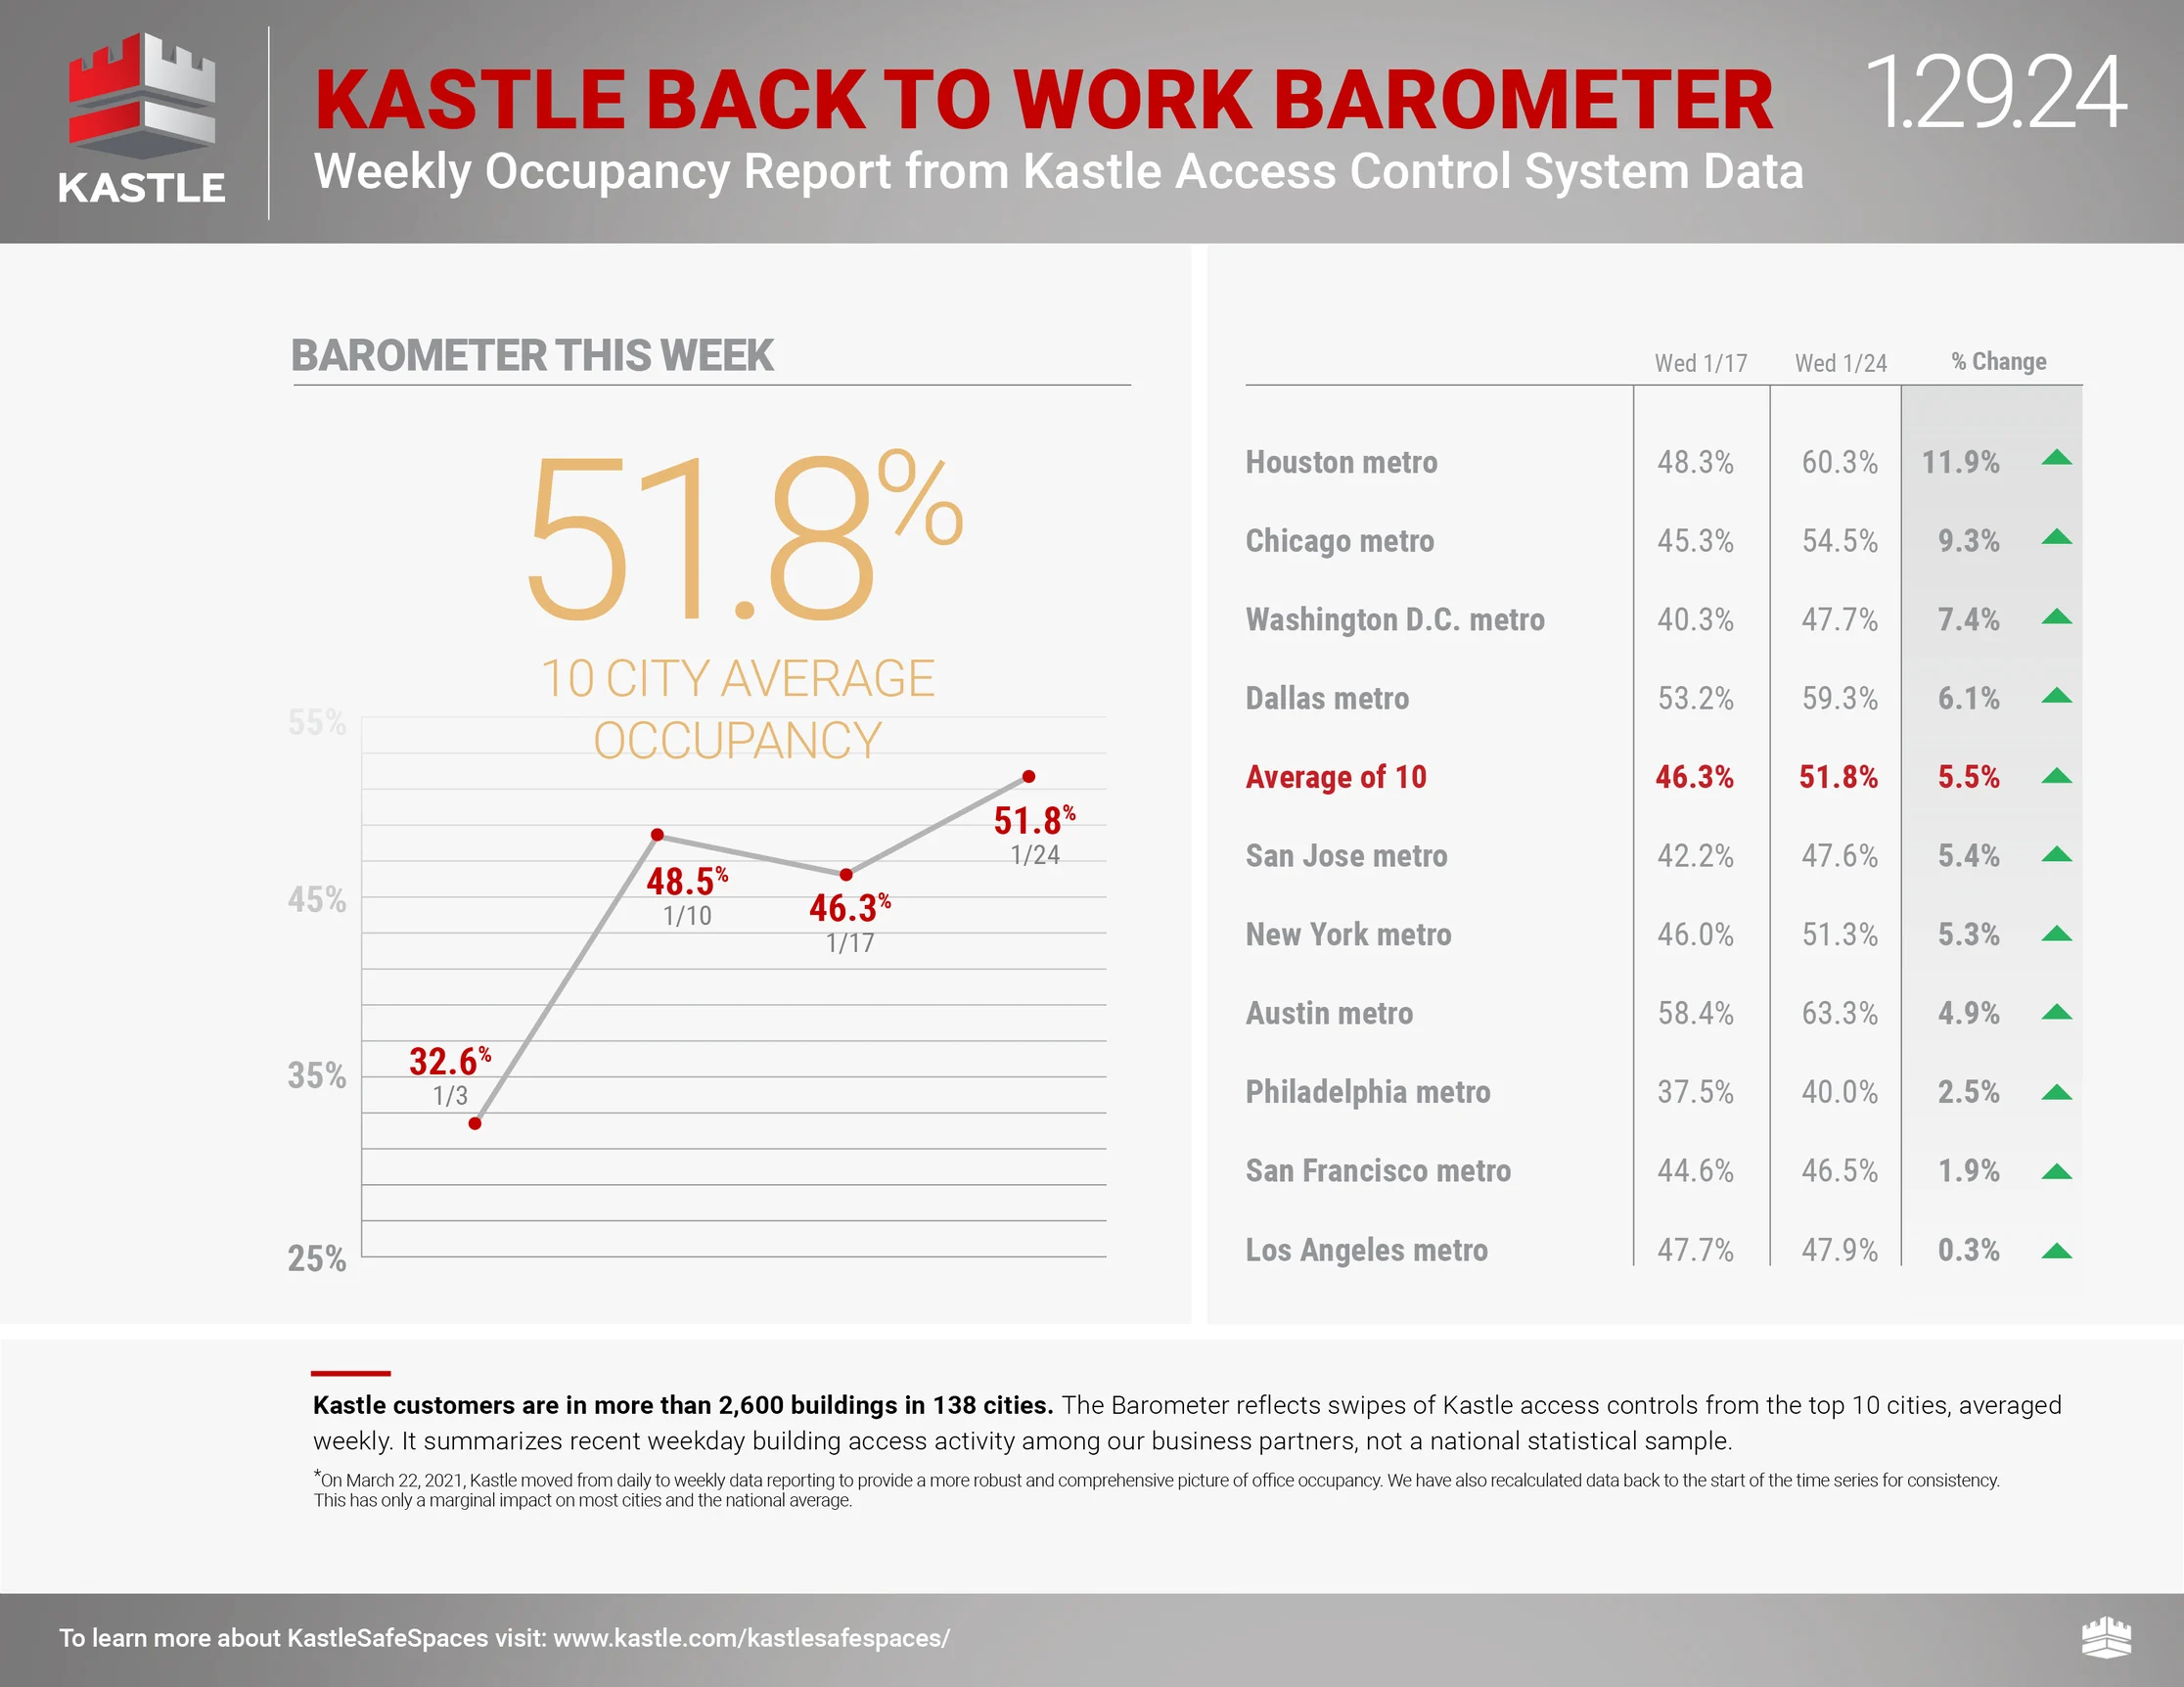
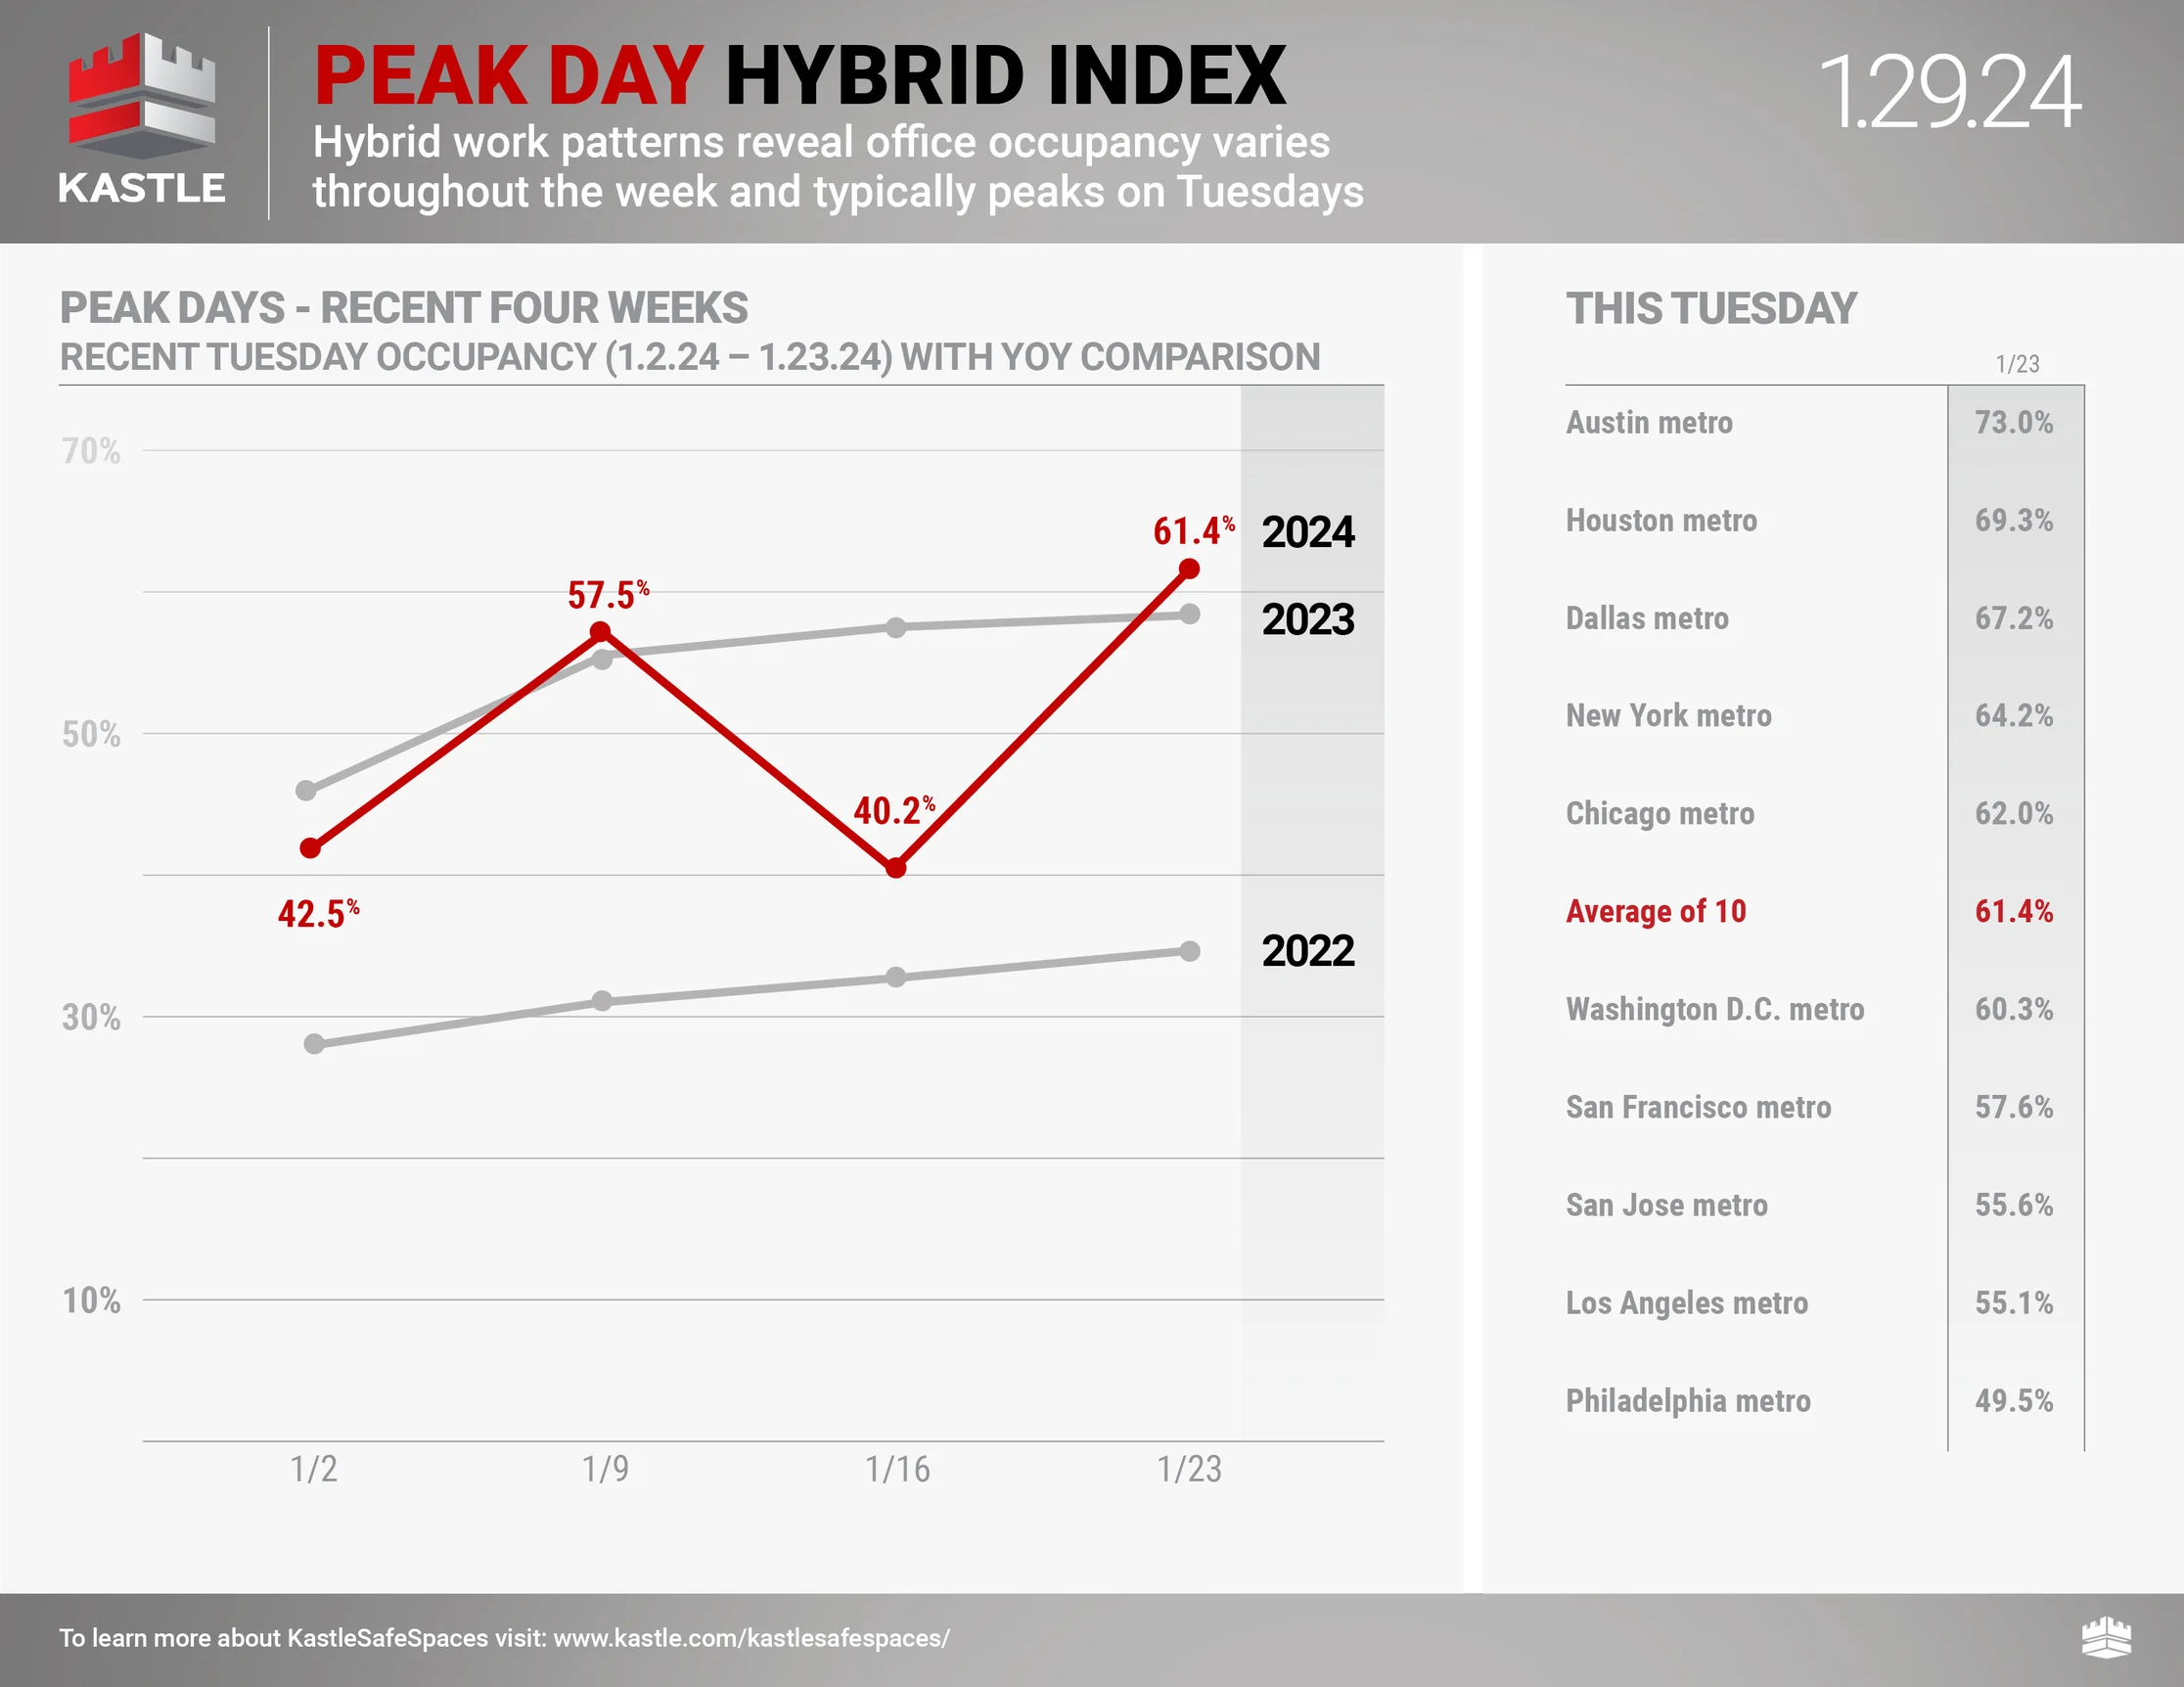
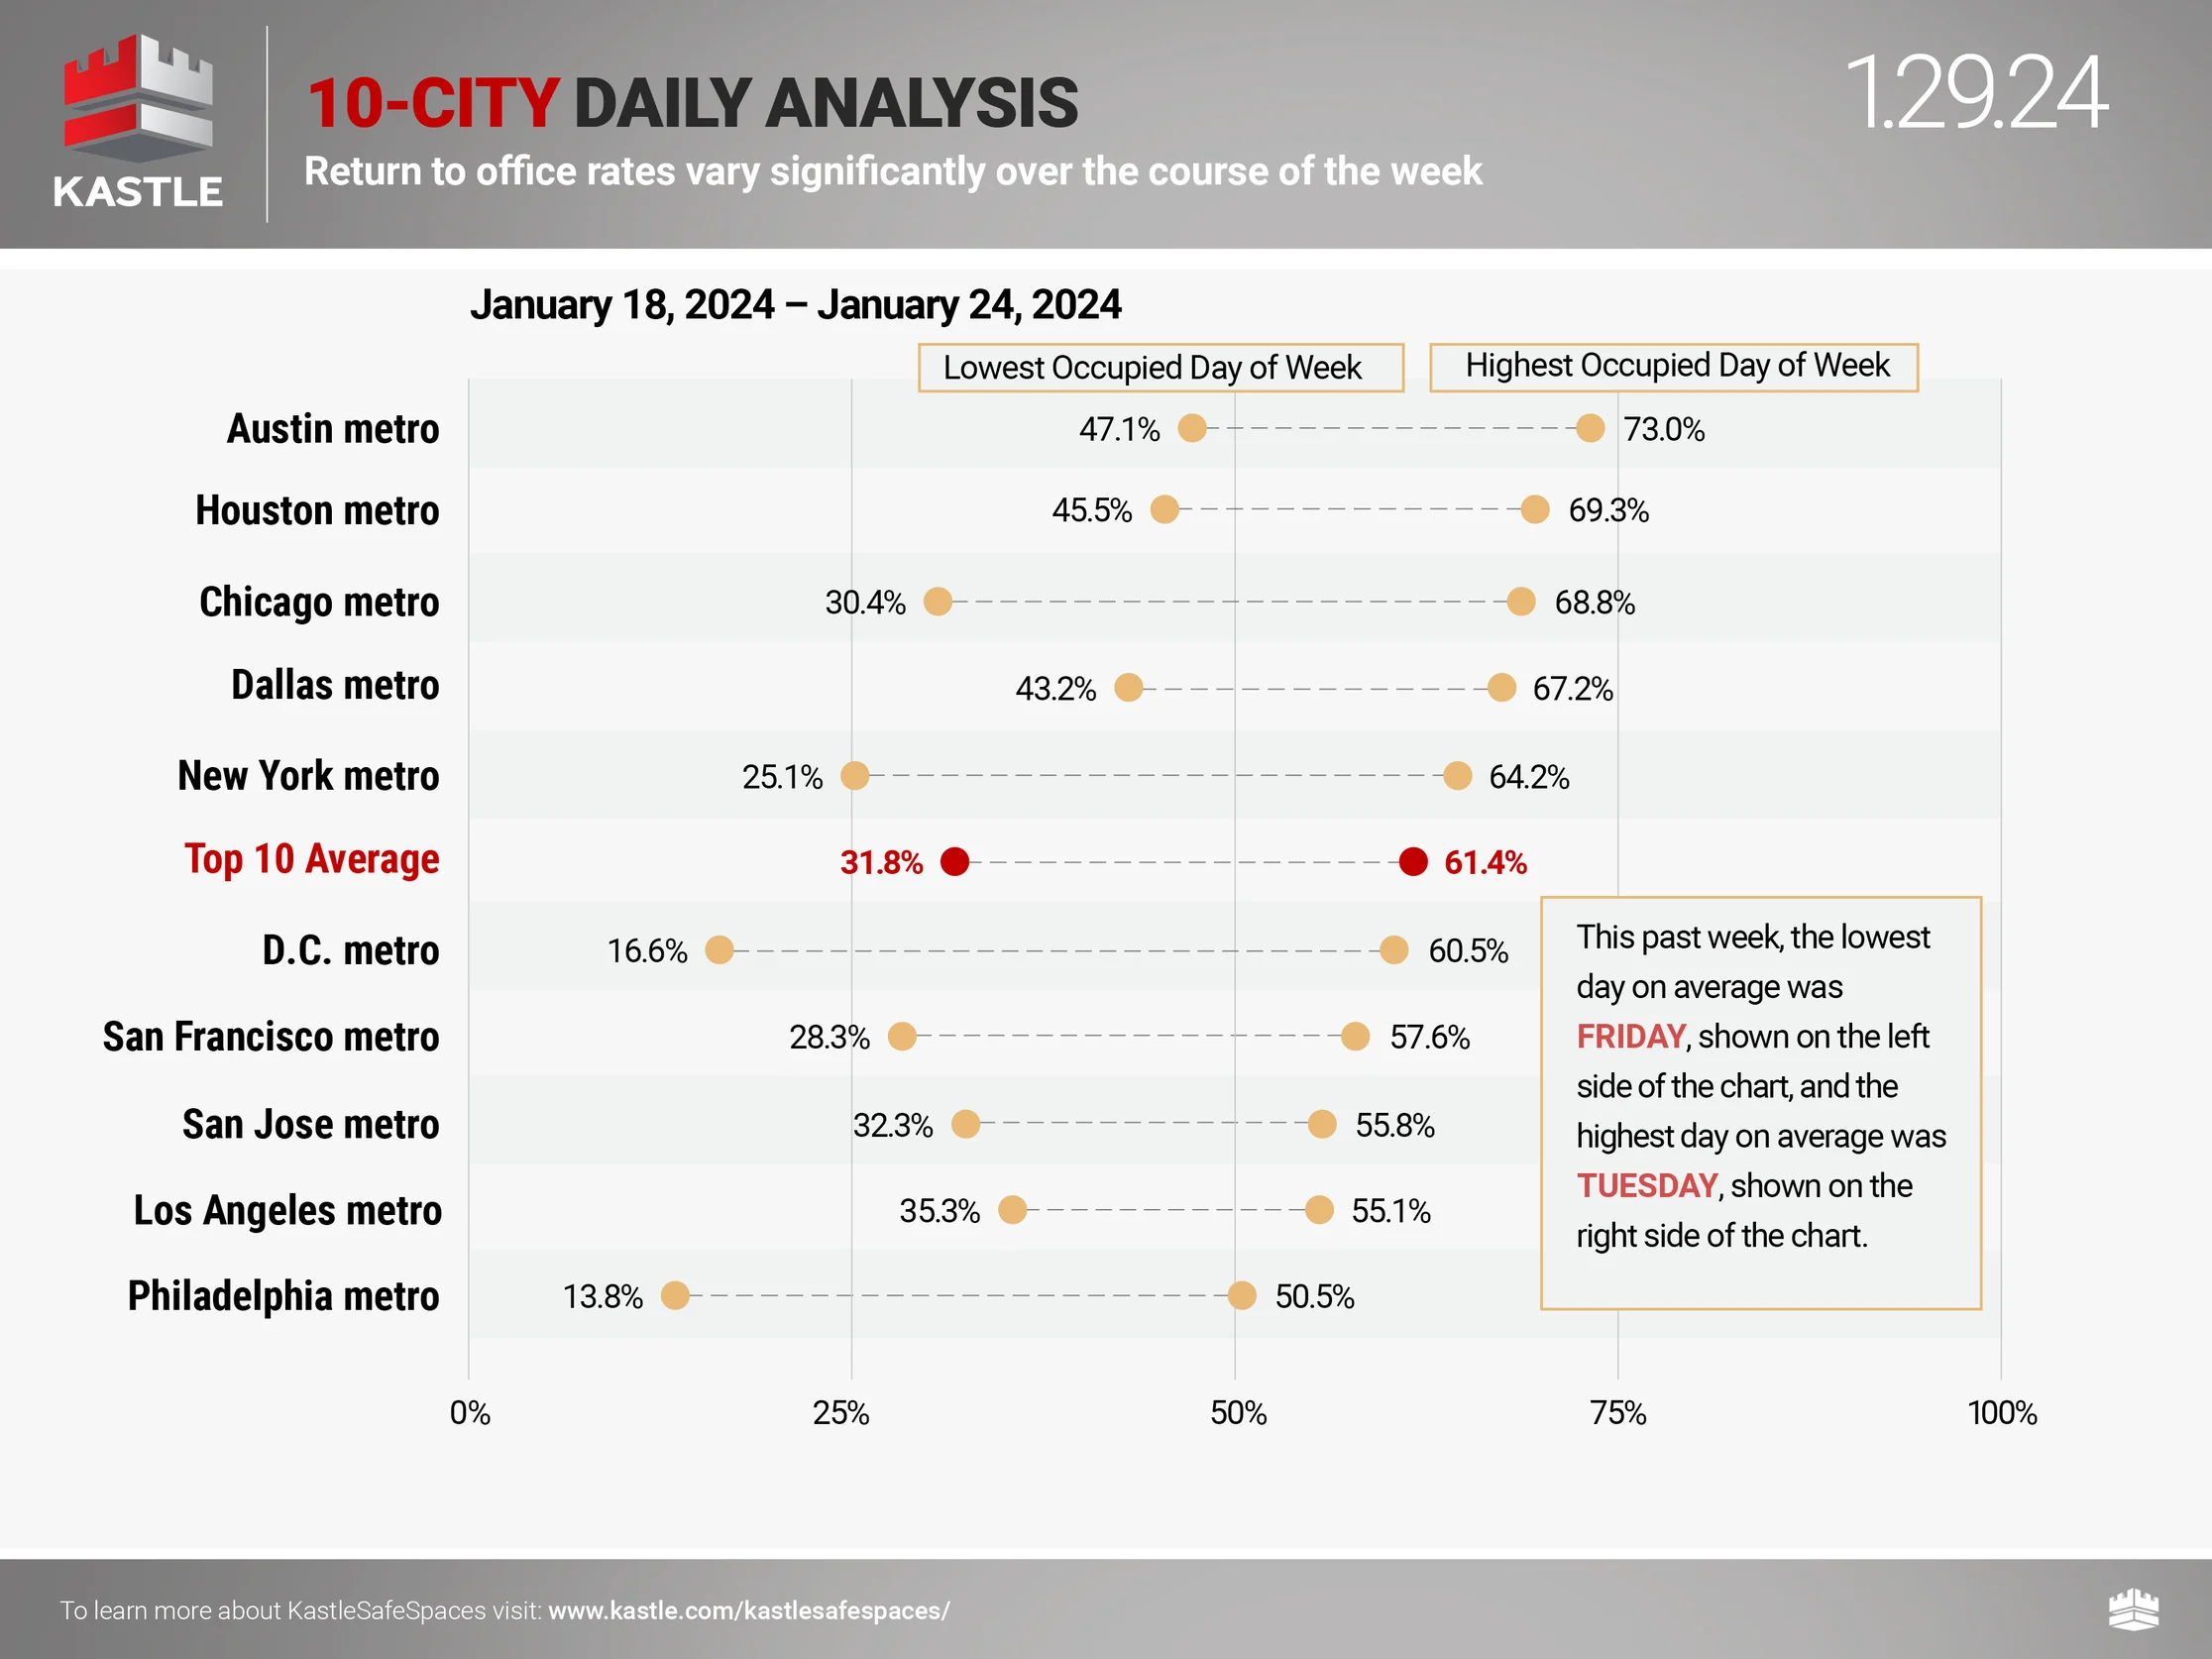
Kastle card swipe data
Remember that Kastle charts are overstating occupancy* because their pre-pandemic occupancy benchmark was 100%, which is incorrect (*measures card swipe activity as a proxy for occupancy). Still, they’ve become the standard benchmark for occupancy rates.
Favorite RANDOM charts of the week made by others
Appraiserville
Taking a break this week.
OFT (One Final Thought)
The optics of the housing market aren’t always obvious, like how many holes a straw has. This is a remarkably good take.
Brilliant Idea #1
If you need something rock solid in your life – particularly on Friday afternoons at 2:00 PM, Eastern Time (ET) – and someone forwarded this to you, you can sign up here for these weekly Housing Notes. And be sure to share with a friend or colleague if you enjoy them because:
– They’ll buy the rate;
– You’ll buy the farm;
– And I’ll be looking for a three-sided straw.
Brilliant Idea #2
You’re clearly full of insights and ideas as a reader of Housing Notes. Consider sharing them with me early and often. I appreciate every email I receive, as it helps me craft future Housing Notes.
See you next week!
Jonathan J. Miller, CRE®, Member of RAC
President/CEO
Miller Samuel Inc.
Real Estate Appraisers & Consultants
Matrix Blog @jonathanmiller
Reads, Listens and Visuals I Enjoyed
- 🗄 Mediocre Office Revival [Highest & Best]
- Keller Williams Settles Sitzer for $70M [The Real Deal]
- NAR CEO Nykia Wright appears — and disappears — in new video [Inman]
- Does 'date-the-rate' constitute deceptive advertising? [Inman]
- New York Asks Realty Company to Investigate Sexual Assault Allegations [NY Times]
- Fed leaves rates unchanged and points to upcoming cuts [Washington Post]
- Where Can Gen Z Buy a Home? [NY Times]
- Estimating the National Housing Shortfall [JCHS Harvard]
- Here’s How Much Biltmore Is Worth After Adjusting for Inflation [The Smokies
- Chart: The pipeline for office-to-apartment conversions is growing fast [Axios]
- The 10 US cities with the longest commute times [Business Insider]
- New homes won the year [Axios]
- Apartment List Renter Migration Report: 2024 [Apartment List]
My New Content, Research and Mentions
- Home Contracts Surge in Manhattan, Brooklyn [The Real Deal]
- 'Everybody's in panic mode': Ultra-rich Americans have mansions on their hands that they can't get rid of — so they're renting out their luxury LA homes for as high as $150K+ per month [Moneywise]
- Look out on the city from high above the Lower East Side in this $3.8M penthouse [6 SQFT]
- Sales For Homes At $100M+ Are Surging [The Real Deal]
- Half of US tenants can’t afford to pay their rent. Here’s what’s ahead [WSVN 7News]
- Nine-Figure Home Sales Are Skyrocketing. ‘Soon $100 Million Will Be $200 Million.’ [Wall Street Journal]
- Nine-Figure Home Sales Are Skyrocketing. ‘Soon $100 Million Will Be $200 Million.’ [Mansion Global]
- Fourth Quarter of 2023 Saw More Hamptons Home Sales, Higher Median Price [27 East]
- WSJ News Exclusive | Mystery Buyer Pays $72.5 Million for New York Townhouse Tied to Former Altice CEO [Wall Street Journal]
- Mystery Buyer Pays $72.5 Million for New York Townhouse Tied to Former Altice CEO [Mansion Global]
- Half of US tenants can’t afford to pay their rent. Here’s what’s ahead [CNN Business]
- Is It Cheaper to Live in Connecticut and Commute to New York City? [US News & World Report]
Recently Published Elliman Market Reports
- Elliman Report: Manhattan Decade 2014-2023 [Miller Samuel]
- Elliman Report: Manhattan Townhouse Sales 2014-2023 [Miller Samuel]
- Elliman Report: San Diego County Sales 4Q 2023 [Miller Samuel]
- Elliman Report: Orange County Sales 4Q 2023 [Miller Samuel]
- Elliman Report: Los Angeles Sales 4Q 2023 [Miller Samuel]
- Elliman Report: North Fork Sales 4Q 2023 [Miller Samuel]
- Elliman Report: Hamptons Sales 4Q 2023 [Miller Samuel]
- Elliman Report: Long Island Sales 4Q 2023 [Miller Samuel]
- Miller Samuel New York City Market Brief 4Q 2023 [3 Year Comparison] | Miller Samuel Real Estate Appraisers & Consultants
- Elliman Report: Weston Sales 4Q 2023 [Miller Samuel]
Appraisal Related Reads
- Are sellers finally starting to thaw out? [Sacramento Appraisal Blog]
- Housing Statistics for Beginners [Birmingham Appraisal Blog]
- The Appraisal Foundation Opens Call for Board of Trustees Members [Yahoo Finance]
- The housing market has ’80s vibes [Sacramento Appraisal Blog]
- Mortgage Fraud Prevention [Fannie Mae]
- The spring housing market is waking up & random stats [Sacramento Appraisal Blog]
- Appraisal Institute Update for the Fourth Quarter of 2023 [PR NEWSWIRE]
- New Legislation Impacting Appraisers [VaCAP Online]
- Appraisal Reviews for $3 – The Devaluation of Appraisers [Appraisers Blogs]
- Convicted Conservation Easement Promoters Get 25 And 23 Years In Jail [Forbes]
- What’s Working and What’s Not Working in CRE | NAIOP [Commercial Real Estate Development Association]
- Murphy administration launches initiative to battle appraisal discrimination [New Jersey Monitor]
- Birmingham Housing Stats: A Final Look at 2023 [Birmingham Appraisal Blog]
- It was a weird housing market in 2023 [Sacramento Appraisal Blog]
- U.S. Home Appraisals Slide YoY in Q3 [DS News]
- Real estate trends to watch in 2024 [Sacramento Appraisal Blog]


![[Podcast] Episode 4: What It Means With Jonathan Miller](https://millersamuel.com/files/2025/04/WhatItMeans.jpeg)