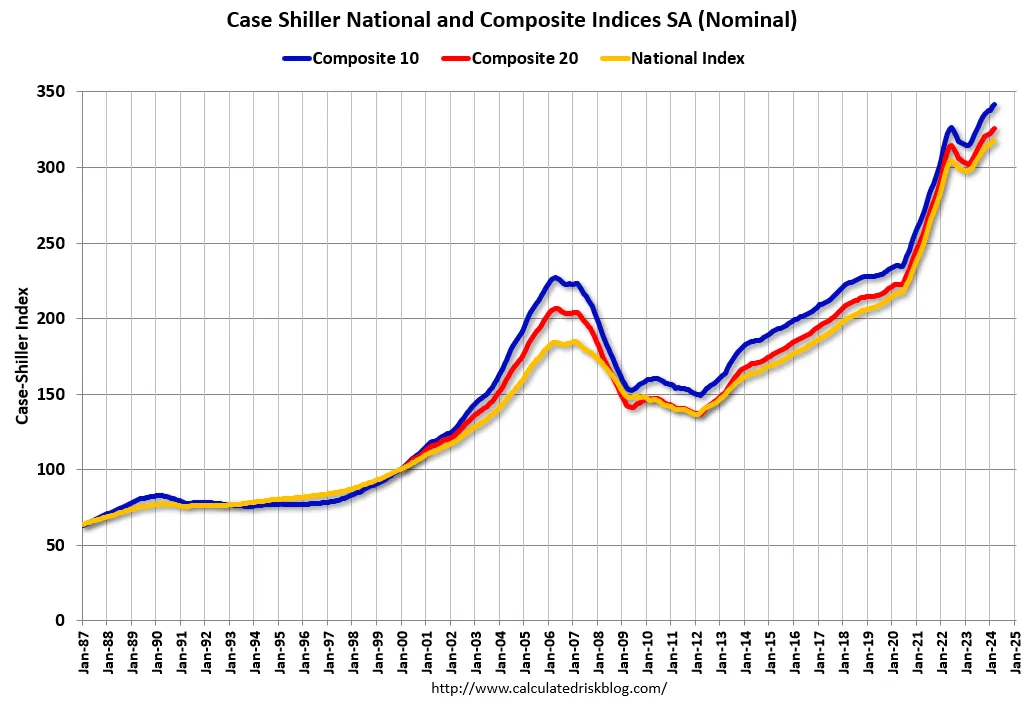
- Case-Shiller set new records but reflects buyer/seller attitudes of last Christmas
- Fed pivoted from NAR (Trade Group) to Case-Shiller (Academia) After The Bubble
- Data collection, access, and analysis abilities supercharged over past two decades
The S&P/Case-Shiller Home Price Index was just published on Tuesday and reached a record high – but don’t pay much attention to it – more on that further on

Question: Does the typical American wake up in the morning and look up the average temperature six months ago to decide what to wear today?
Answer (if you weren’t sure): No, they don’t.
Back in 2007, I was brought in by a Manhattan startup designed to compete with the S&P/Case-Shiller Home Price Index (CSI). I was the “non-economist” facing Robert Shiller, a legendary economist and later a Nobel Laureate. Shiller and his colleague Karl Case envisioned a platform to enable investors to hedge housing, the world’s largest asset class. After all, investors could hedge weather, insurance, coffee, nonfat dry milk, orange juice, and cheddar cheese. Why not housing?
But first, sea kayaks and coordinates

I apologize for the ridiculous wonkiness of this long-winded post but I needed to get this story off my chest. This is not another People Magazine exposé so please try to stay with me until the end as I provide context to make my point.
I first met Dr. Shiller in 2007 in the green room at Lincoln Center on the Upper West Side of Manhattan. I was star-struck. We were part of a Real Deal Symposium, a real estate event hosted by the essential The Real Deal magazine on stage in front of about 3,000 attendees. Dr. Shiller and I were the first in the green room and had a nice conversation. He eventually gave me the latitude and longitude coordinates for his vacation home when he heard I was an avid sea kayaker. Now that was a flex. Sadly I no longer have the coordinates and am giving away my sea kayak to a friend since I’ve moved inland. After the event, we ran into each other several times in the middle of Grand Central Terminal which seemed improbable, and he saw me as “the appraiser guy.”

Radar Logic crashed and burned but was a better mousetrap than CSI
The startup I joined n 2007 was called Radar Logic (RL), which eventually failed after the financial crisis. It was powered by super nice rocket scientists who had done previous (literally stellar) consulting for NASA – they continue to read these Housing Notes! The original purpose of both CSI and RL was to trade options to enable investors to hedge against the residential housing market. I understood Goldman Sachs was CSI’s only licensee (and investor) at the time yet RL firm sold licenses to all the major investment banks including Goldman Sachs. And look! The CSI index continues to be gamed.

For the first time, housing data was indexed to be used as a platform for options trading to enable investors to hedge against housing downturns. The key downfall of the effort was the lag time, eventually seeing startups like Zillow and others reasonably predict the CSI in advance every month. The ability to accurately forecast the results in advance disincentivized trading at scale and therefore, no real hedging against the housing market could be accomplished.
The actual ownership versus licensing by S&P seems complicated but I know the indices were acquired from Fiserve by CoreLogic but they are branded by S&P who thinks of it as some sort of prestigious market tool. However, the purpose of CSI has not been fulfilled – to hedge against the housing market. The last time I looked into it, trades were occurring only by the handful on the Chicago Mercantile Exchange yet I was told by Wall Street types back when I was involved that there needed to be hundreds of thousands or millions of trades to be a viable platform to hedge housing.
CSI was created using a repeat-sales methodology: a home sells today and it last sold 17 years ago. A calculation of the change is made between the new and old prices plus thousands of additional comparisons layered on top of them.
For my New York readers, the New York CSI of the 20-City Index reflected single family sales in NYC, Long Island, The Hamptons, Westchester County, Fairfield County, a bunch of counties in northern New Jersey, and a county in Pennsylvania. Does that sound like a relevant home price index for Manhattan, in which 1-3 family sales only represent around 2% of residential open market properties? And residential open-market single-unit properties are only 25% of total units in the borough? Manhattan is primarily (75%) a rental market. In other words, the current use of CSI is of little value for the consumer, but the media doesn’t understand that.
An aside about FHFA
Within the same family of repeat-sales indices, the Federal Housing Finance Agency Home Price Index (FHFA) is also of little value in the consumer market for the same reasons, whose handlers appeared desperate to get noticed during the heyday of Case-Shiller. FHFA is the regulator over Fannie Mae and Freddie Mac, also known as government-sponsored enterprises (GSEs). The key FHFA differentiator is that the data is based on sales with conventional mortgages, and gives less weight to older repeat sales – it does not include new development, cash sales, and properties purchased with jumbo mortgages (in other words it excludes the big stuff). During the housing bubble, FHFA handlers were aggressively blogging their critiques of Case-Shiller but those are no longer online.
With its significant lag, and only one data point per month, S&P for the past couple of decades has continued to throw the monthly results into the media landscape in an attempt to put to use something they paid for. To this day, it is not clear why media outlets continue to cover the CSI monthly results. In fact, for many years, an S&P executive would make the news rounds explaining the results using listing inventory and sales data from other sources to reverse engineer their own CSI results. CSI is a price index and doesn’t track sales or listing inventory.
But I digress…
During my time in this space, I noticed that the Fed finally pivoted away from a trade group for housing market insights, shifting to academia and then finally a broader data source from the private sector. Here is how I looked at the Fed’s quest to search for better housing market insights.
1. The Fed relied on NAR for years (a trade group)

During the housing bubble, the National Association of Realtors twisted itself into pretzels to explain the results of their various indices without being negative. The two big indices they pushed were and are the monthly Existing Home Sales (EHS) and the Pending Home Sale Index (PHSI). They remain useful resources but I wonder if they will continue to be produced if NAR collapses in a few years.
For decades, NAR was the defacto authority on the housing market, relied on by the Fed. I believe this was more about them having the data. Nationally, they championed that housing prices hadn’t declined in nearly a century (in aggregate) so it’s a hop, skip, and a jump to say housing prices don’t fall. The media punched out their monthly results like clockwork without question. However, when NAR stumbled during the financial crisis as housing prices fell in aggregate for the first time, describing the housing bubble as merely a “balloon with a slow leak” and suggesting the global credit crisis would only last a few months instead of years, it revealed the true weakness of relying on a trade group for neutral insights.
2. The Fed switched to S&P/Case-Shiller

The Fed pivoted away from reliance on NAR’s data and shifted to greater reliance on CSI. I saw it more as a switch from a trade group to academia. Case-Shiller was most well-known for its 20-City index and its popularity surged during the 2006-2012 housing bubble. Academia was seen as the more neutral option to avoid the trade group bias experienced at NAR.
The results are calculated with a black box so let’s look at the timing issue.
- The S&P/Case-Shiller Home Price Index published at the end of June was based on the average of closed sales that occurred from February through April.
- CSI waits two months – May and June for more recorded sales to show up with more closed data points.
- If you assume an average of sixty days between the contract date and the closing date, a signed contract period of December through February was used for CSI’s June report results.
- In other words, the June CSI released this week reflected the meeting of the minds between buyers and sellers partially overlapped Christmas. Can you see the problem here?
Placing the half-year delay aside, it is a price trend indicator and doesn’t look at any early warning metrics like months of supply (sales versus listing inventory).
During the run-up to the Housing Bubble and the notion that Case-Shiller was born out of stock market theory (remember the book Irrational Exuberance?), perhaps false conventional wisdom (isn’t conventional wisdom always false?) developed during the housing bubble that the housing market had the liquidity of the stock market. It never did. But that’s for another article.
3. The Fed switched to CoreLogic (private sector)

The Fed seems to have settled with CoreLogic (CL) which now owns the Case-Shiller indices for their much broader housing market insights since the reliance on academic research probably proved to be too slow and not as reactive for real-time analytics. While CL also uses the repeat-sales methodology, they are a data monolith, and have a broader array of housing data for the Fed to use. In addition, the data world has changed over the past several decades as well as the ability to analyze it.
Final Thoughts
I have observed that the Fed has gone through a series of data sources over the past several decades, as the ability to collect, compile, and analyze information improved. They continue to seek to understand the state of the housing market. Back in the day, NAR was the gatekeeper of most housing data, and to a lesser degree, so were real estate agents. The Fed’s pivot to academia was probably from the realization that NAR was providing skewed insights during the bubble era (a balloon with a slow leak). The Fed’s pivot to the private sector for data makes the most sense in the long run with more expansive data to review and less risk of biased insight.
After all that, my concern is that while the Fed is waiting for data to make the next call on rate cuts, the data by definition is always behind the real-time reality. Developing preliminary insights is what is needed to avoid waiting too long to make a rate move. I believe we are very close to the right moment to make a rate cut, but like the housing frenzied distortion of 2020 to 2021, I fear the Fed will again wait too long to decide on a rate move like they did in early 2022.
Did you miss yesterday’s Housing Notes?
Housing Notes Reads
- Unaffordability Expected to Remain Primary Constraint on Home Sales [Fannie Mae]
- Deal in place to sell REcolorado to private equity firm [Real Estate News]
- Commercial Property Appraisers Are Growing In Influence As Market Morphs [Bisnow]
- The Average Appraiser Is Aging Out Of The Workforce. A Crippling Labor Shortage Looms [Bisnow]
- U.S. home prices set new record high, but growth is slowing, Case-Shiller says [MarketWatch]
- Vornado’s 220 Central Park South Notches $82M Resale [The Real Deal]
Market Reports
- Elliman Report: Manhattan, Brooklyn & Queens Rentals 5-2024 [Miller Samuel]
- Elliman Report: Florida New Signed Contracts 5-2024 [Miller Samuel]
- Elliman Report: New York New Signed Contracts 5-2024 [Miller Samuel]


![[Podcast] Episode 4: What It Means With Jonathan Miller](https://millersamuel.com/files/2025/04/WhatItMeans.jpeg)