Red Lobster Represents Land Management – Rock Lobster Represents Housing
It’s not just about endless shrimp driving Red Lobster to bankruptcy. It was a land play and the new owner forced Red Lobster to pay wildly high rental rates on its land.
Did I tell you that I used to be a lobster fisherman? I sold my boat a few years ago but I lay claim to catching the most expensive lobster on the northeastern seaboard (when you add the cost of the boat, gas, insurance, the slip, maintenance, lobster pots, and bait).
But first – the endless shrimp story…
And then the land story…
And then an important observation about the two sides (endless shrimp versus land) angle of this debate.
And now this to forget all your worries about the housing market (temporarily).
Did you miss last Friday’s Housing Notes?
May 17, 2024: The Spring Market Hasn’t Really Sprung With Or Without Cheeseballs Or A 40,000 DJIA
But I digress…
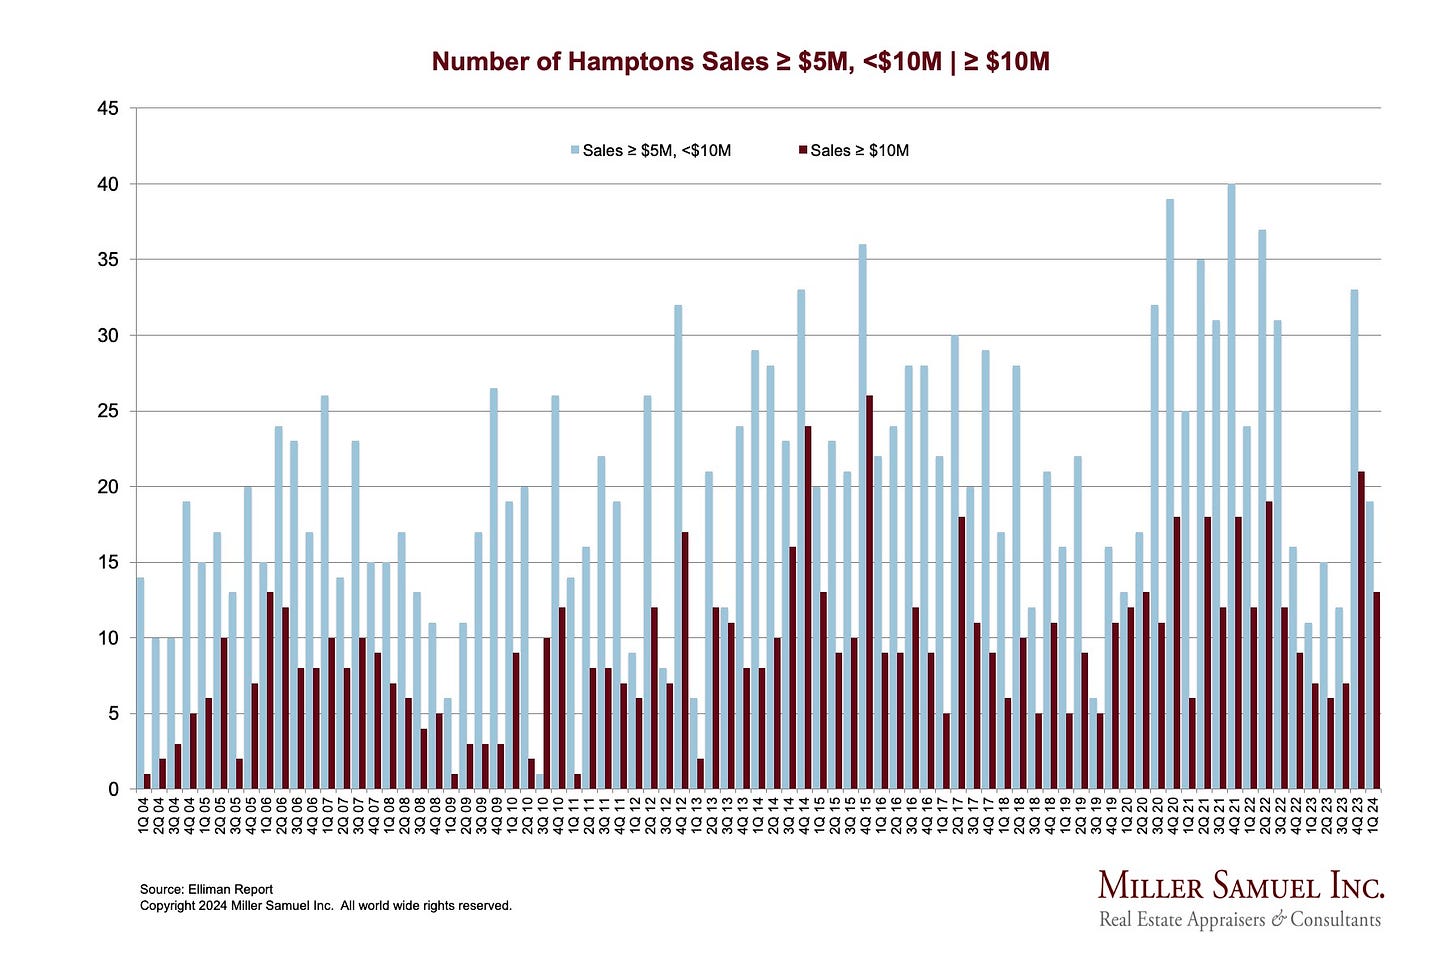
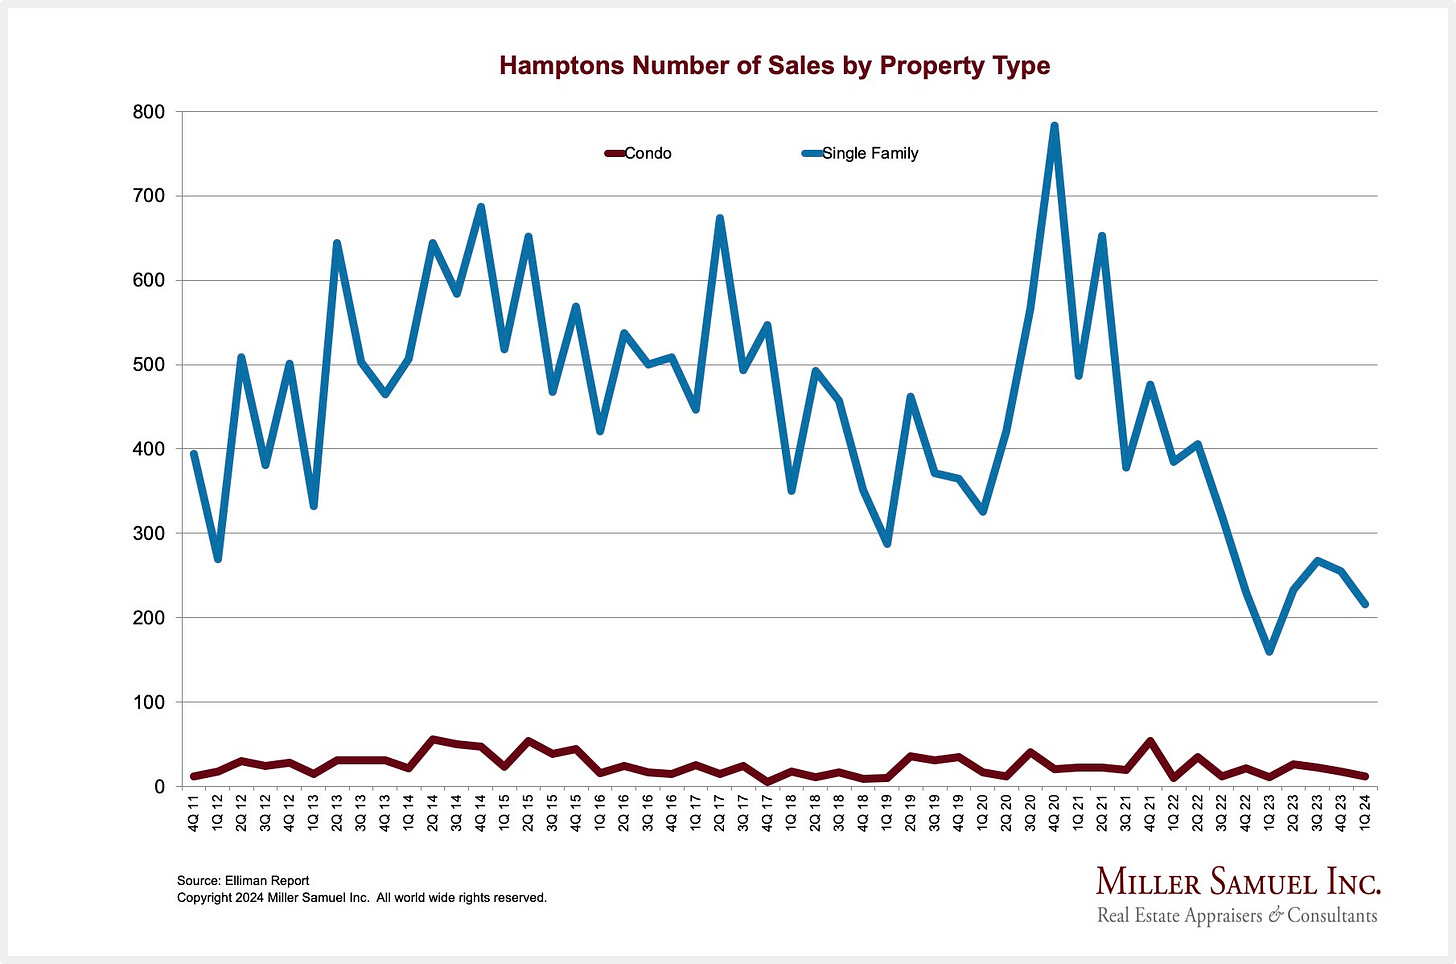
NYT Noticed The Bump In High End Hamptons Sales
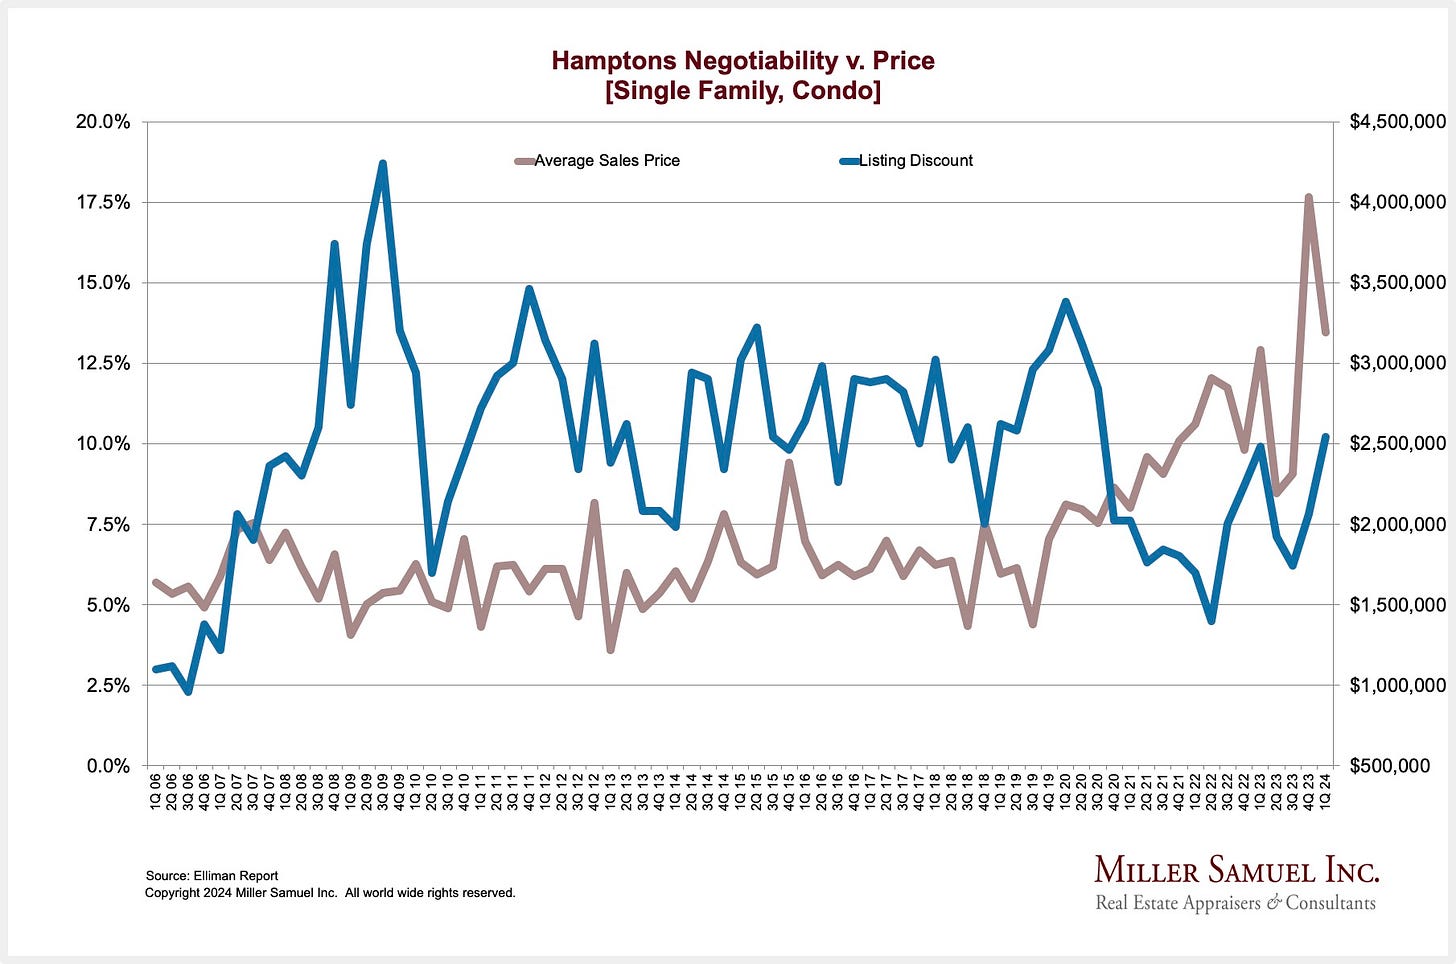
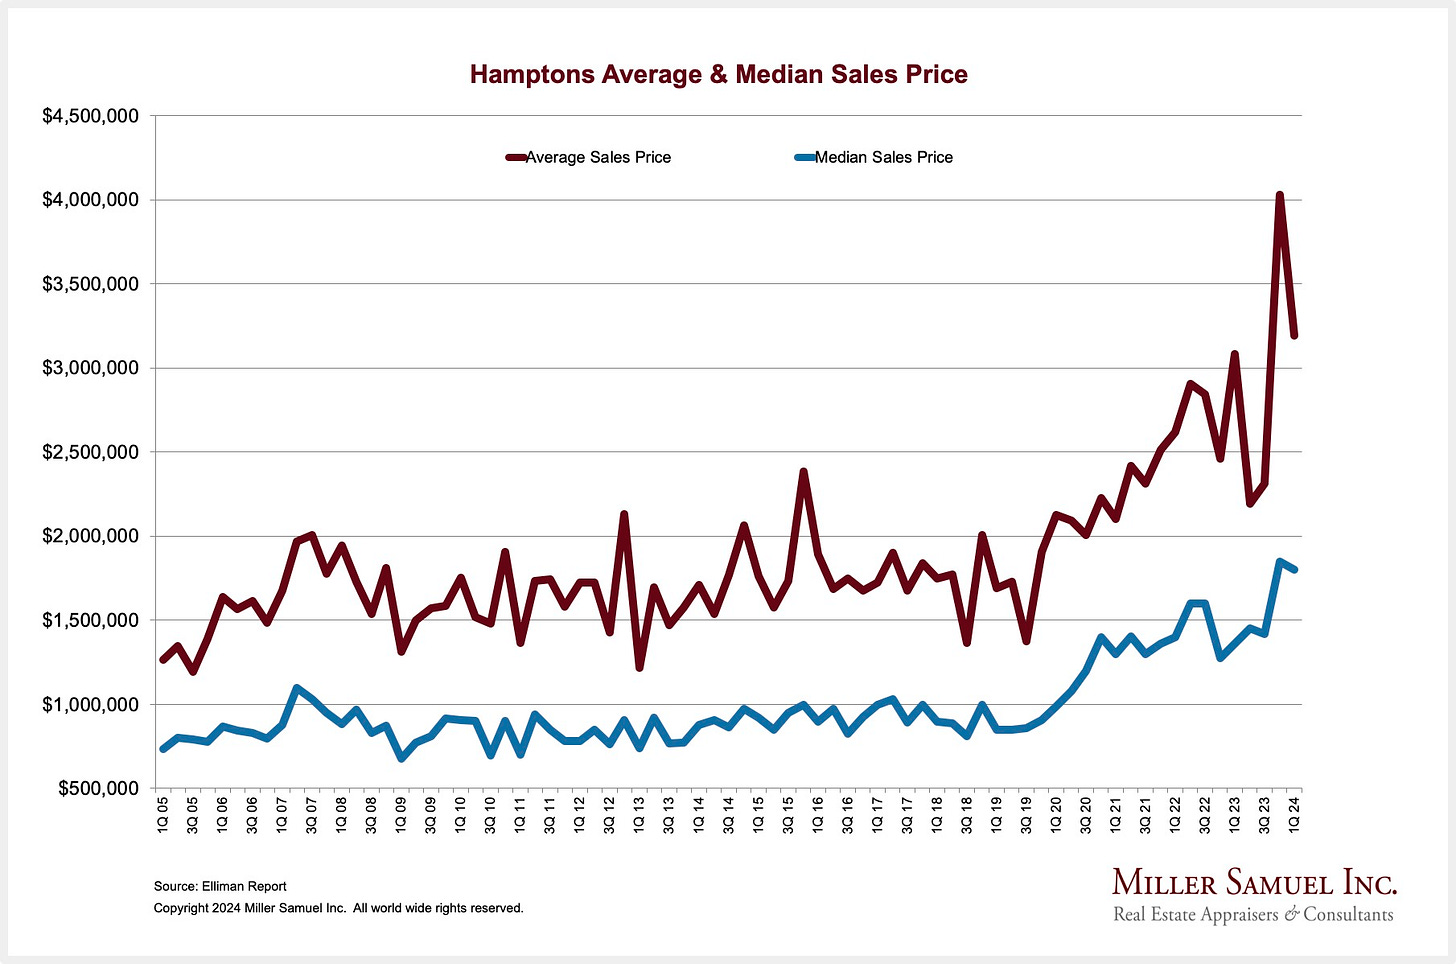
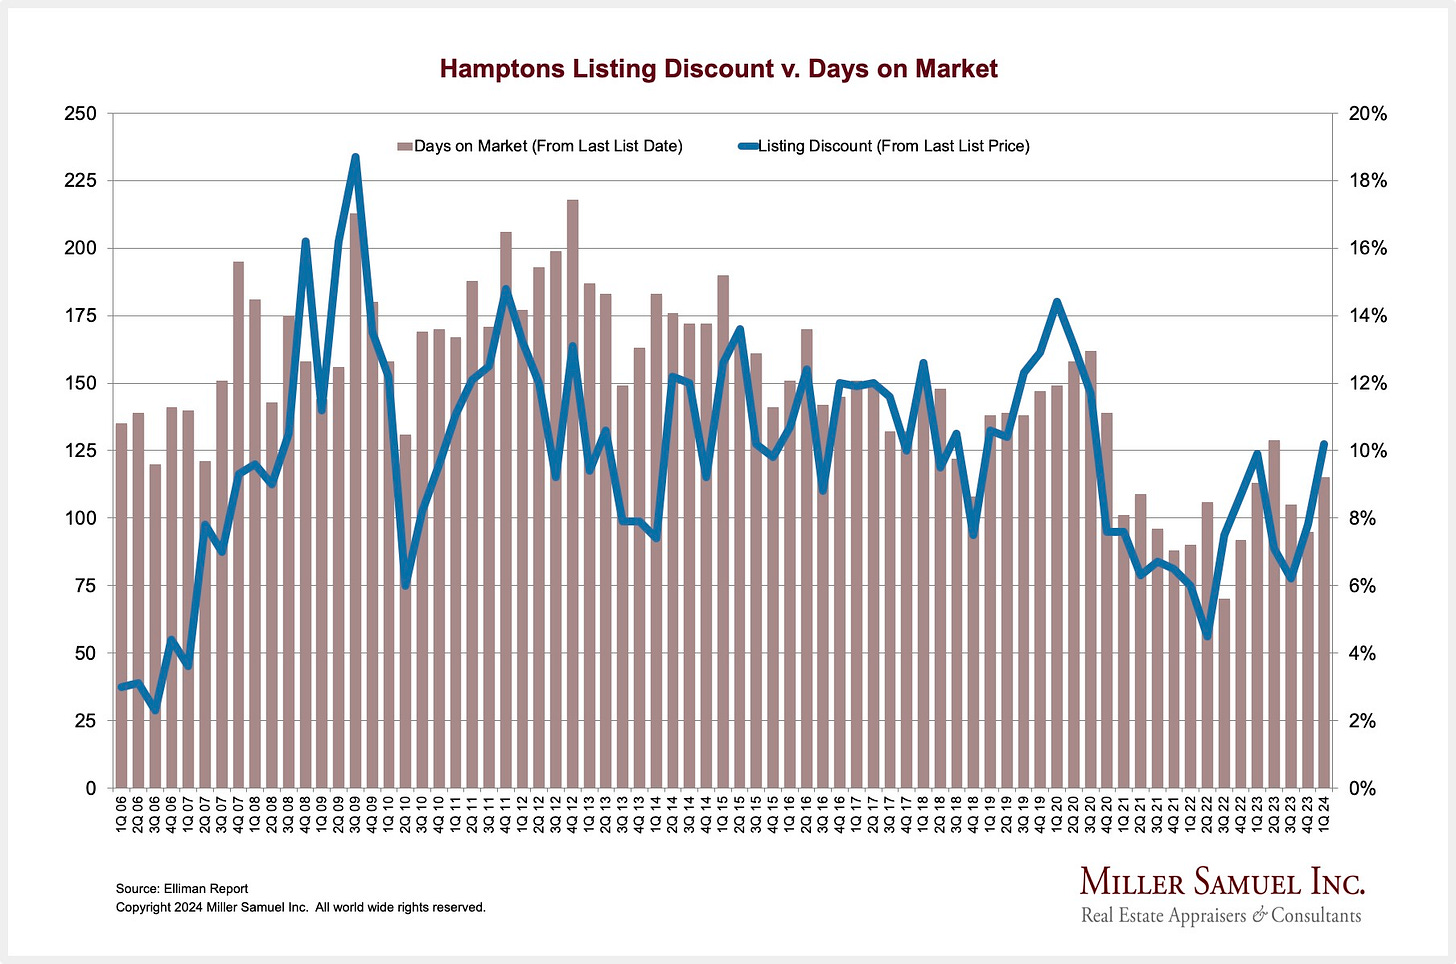
I’ve been the author of the Douglas Elliman market report series for thirty years which includes the Hamptons on the eastern end of Long Island.
Elliman Report: Q1-2024 Hamptons Sales
NYT Calculator: Houses Up, Condos Down. What’s Selling in the Hamptons These Days?
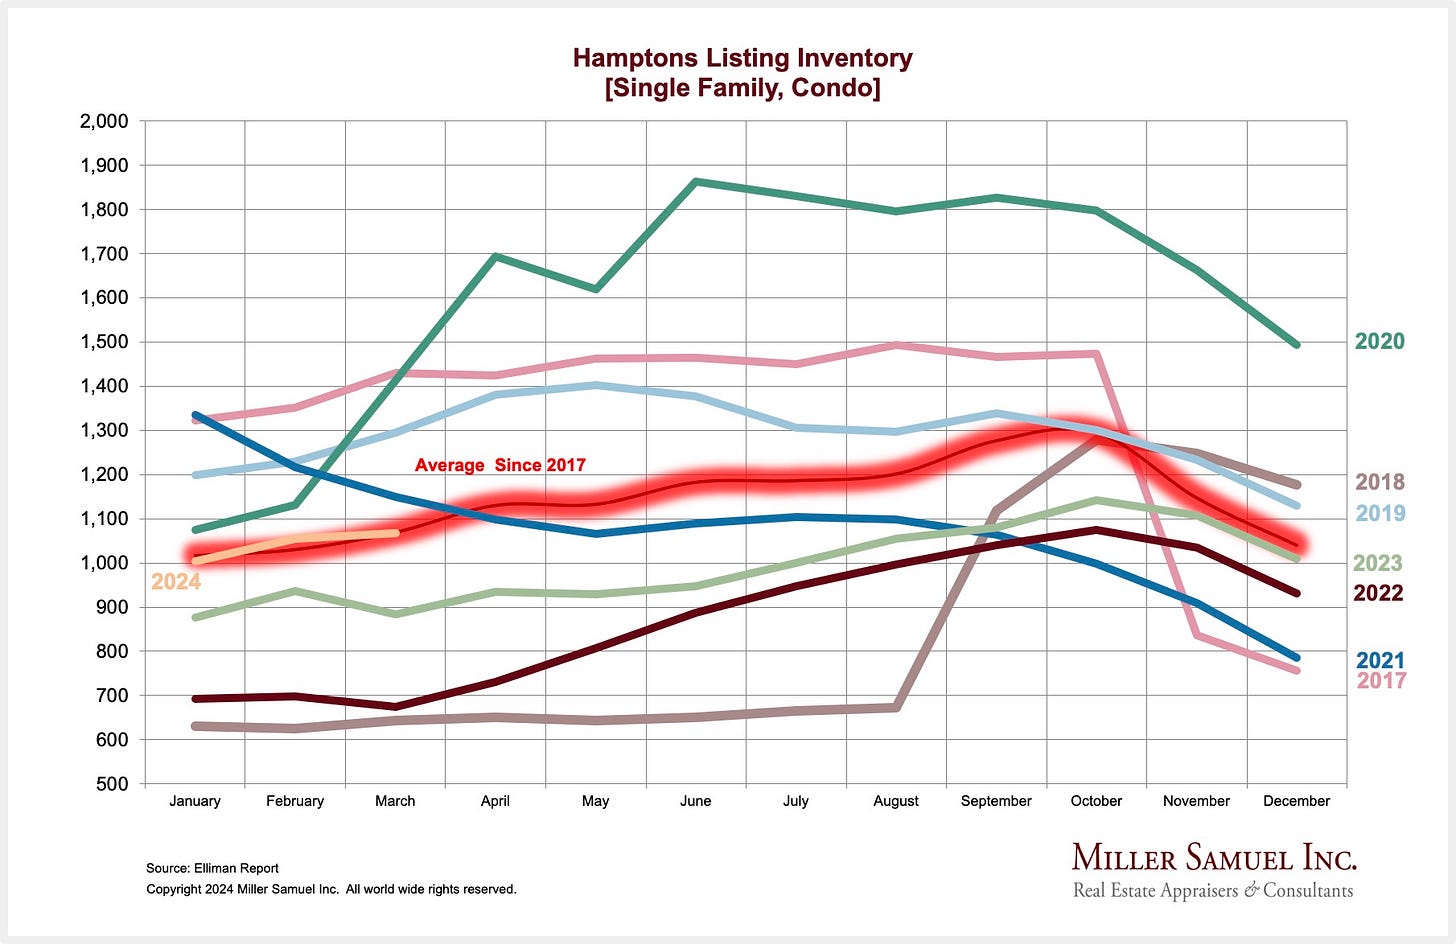
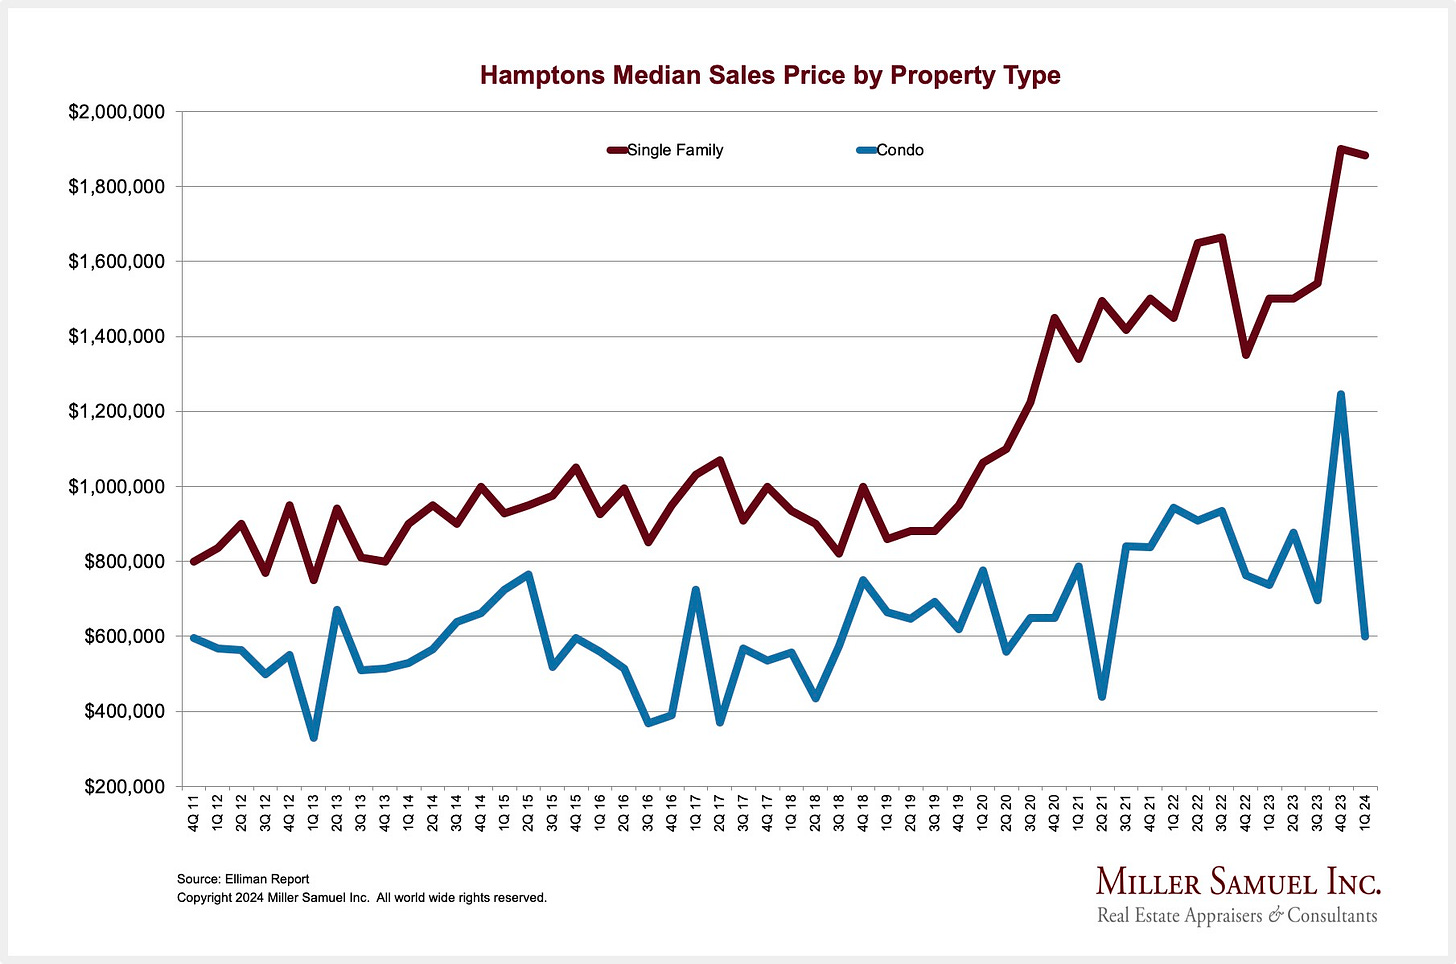
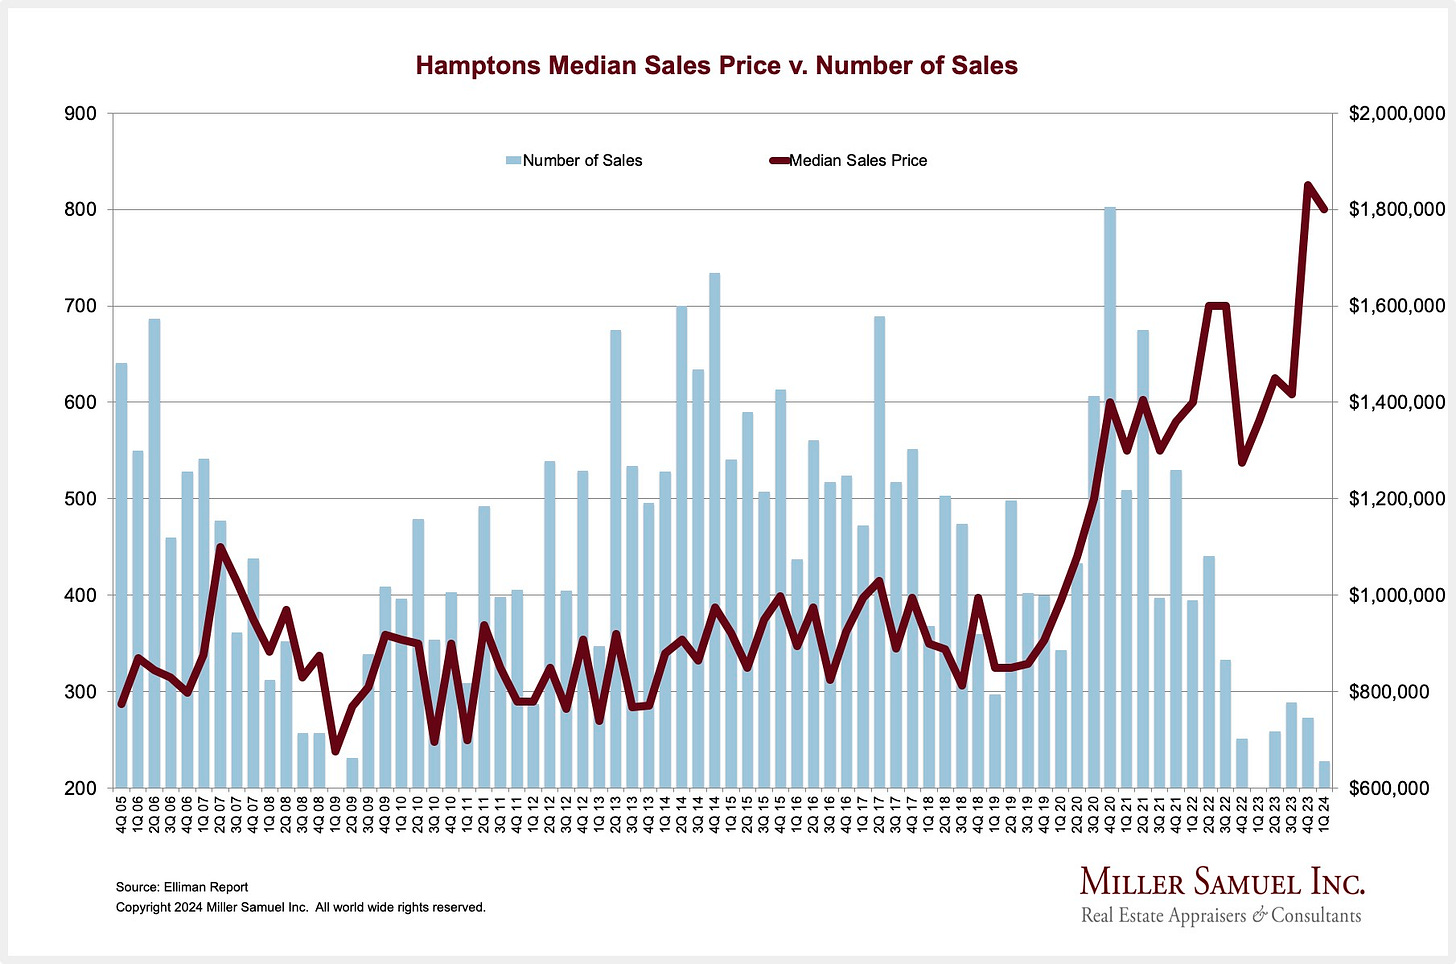
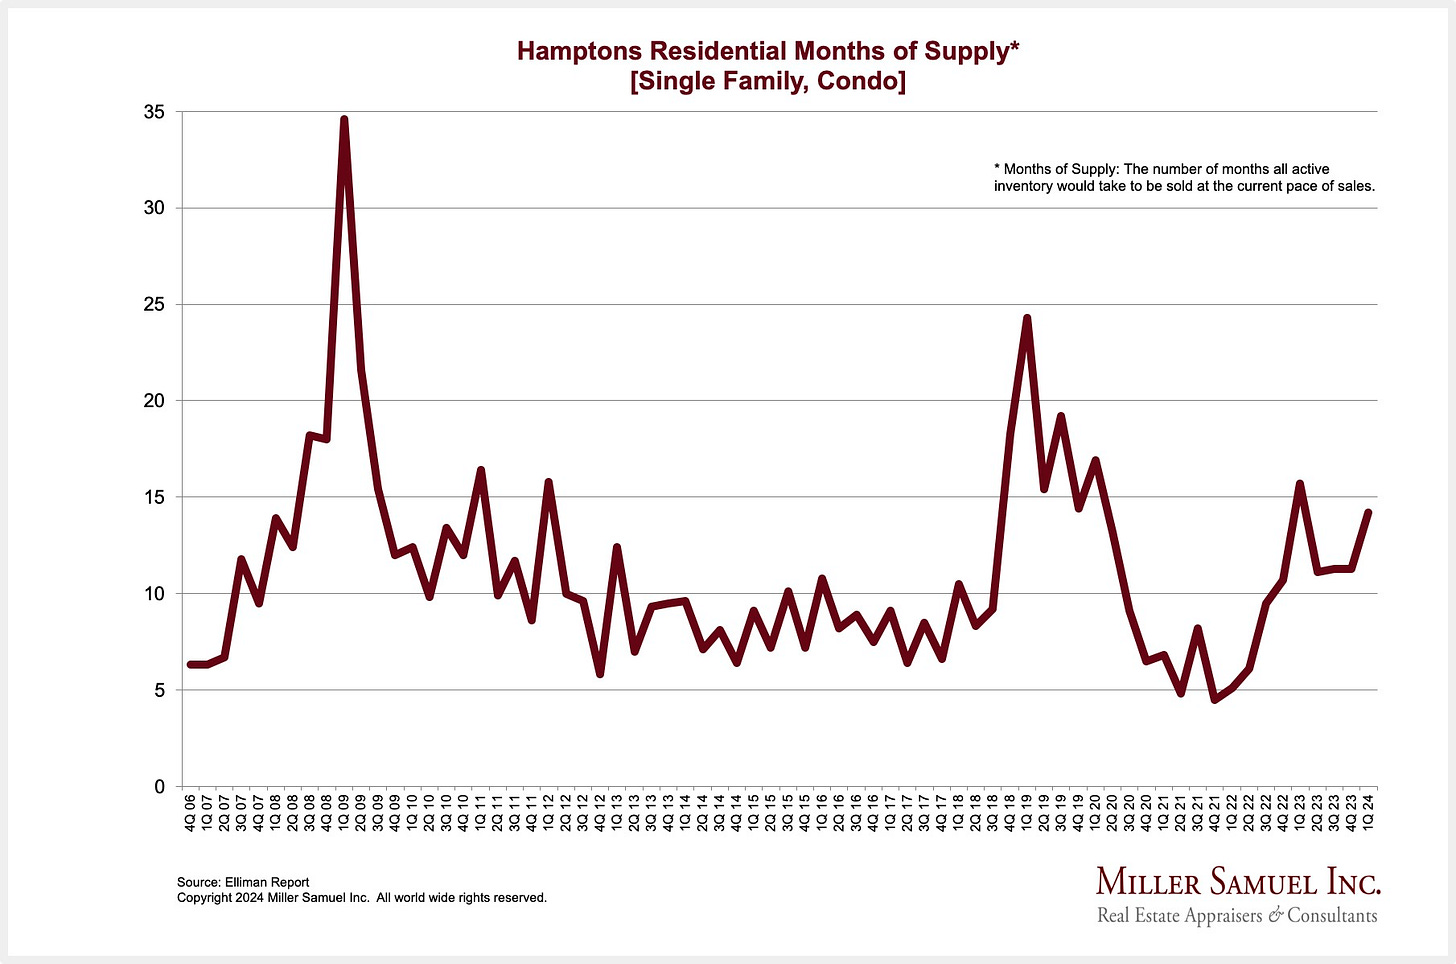
For the Memorial Day Weekend, the Sunday New York Times real estate section is featuring our Elliman Report results on the Hamptons in their Calculator column. It’s a good quick synopsis of what’s happening in the eastern Long Island housing market.
And while we’re at it, here’s a bunch of Hamptons charts we’ve presented using our data.
Bidding Wars For Florida Housekeepers
The run-up in wealth from the Florida inbound migration story created outsized demand for more than housing.
Florida’s wealth boom has touched off a housekeeper shortage. Salaries for experienced housekeepers in Palm Beach more than doubled since 2020, and a typical housekeeper salary is now $110,000 to $150,000. Want to know more about the lives of the global wealthy? Sign up for CNBC’s “Inside Wealth” newsletter at the LinkInBio. #cnbc
Supply and demand sweep the market (pun intended).
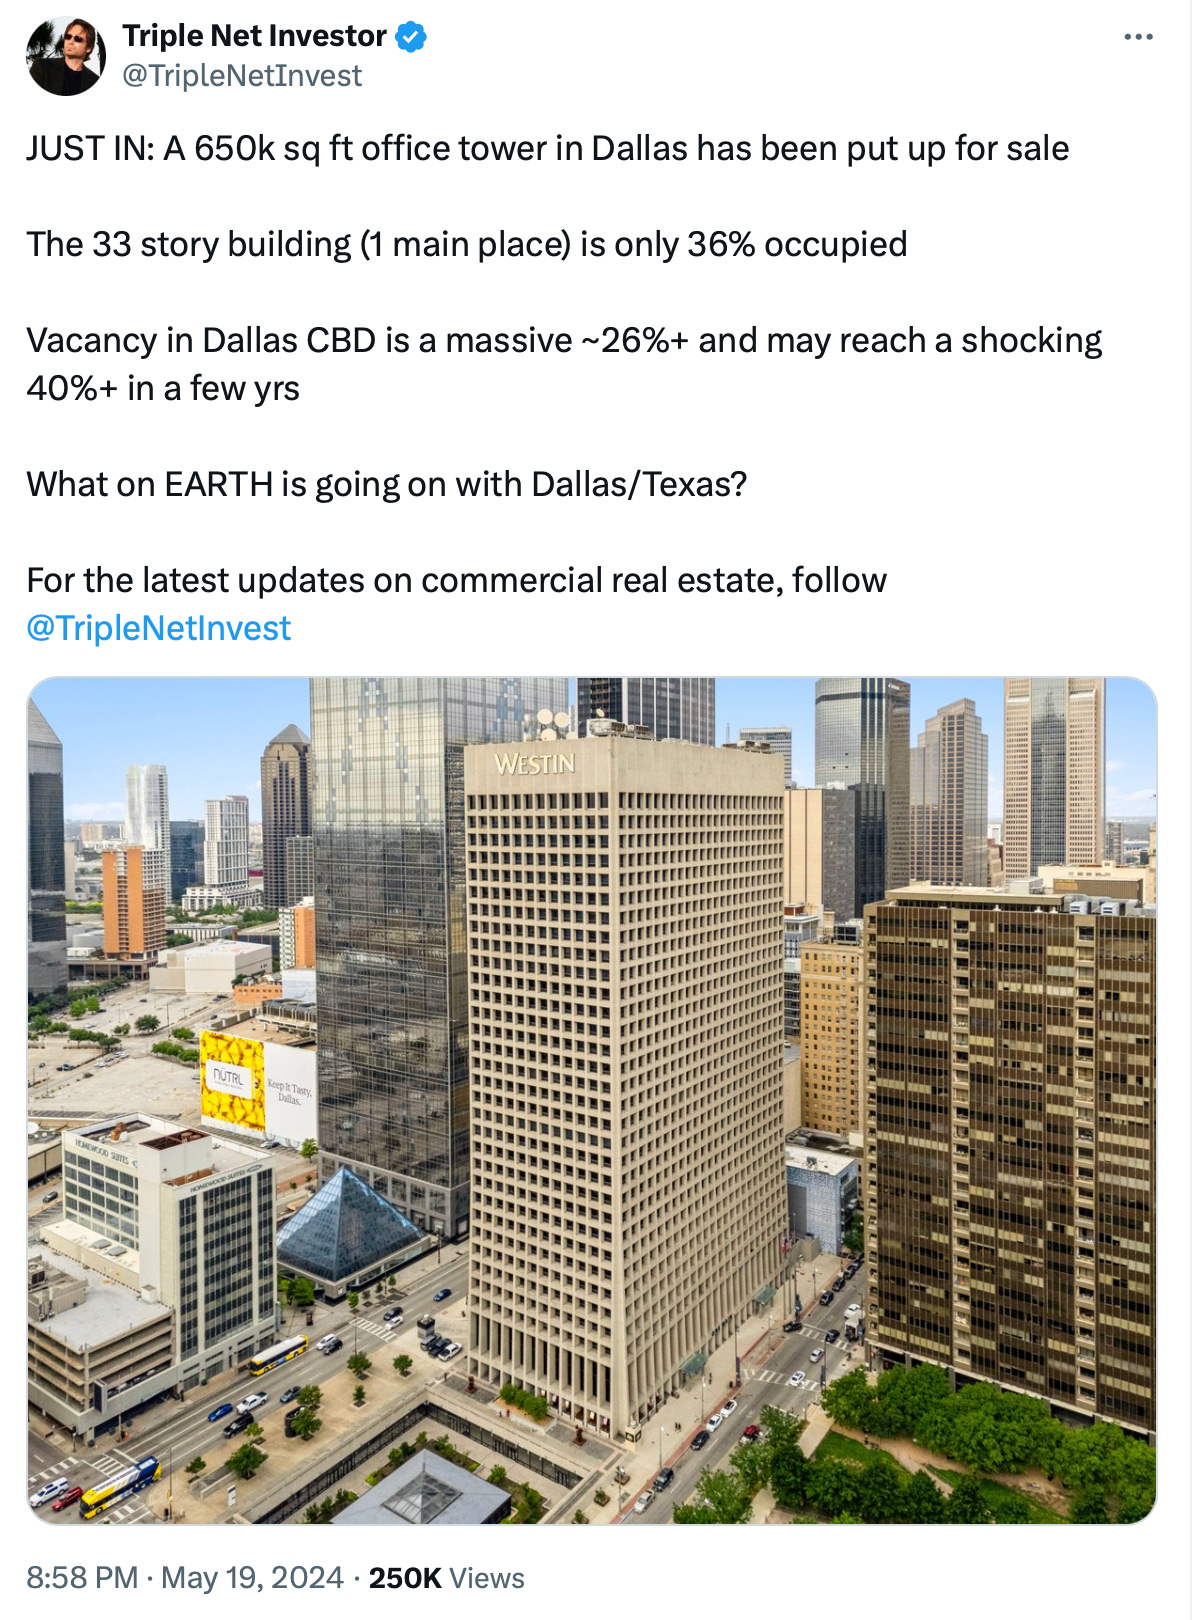
The Commercial Real Estate Crush Continues
This has become my weekly cathartic response to the WFH impact on the commercial real estate market.
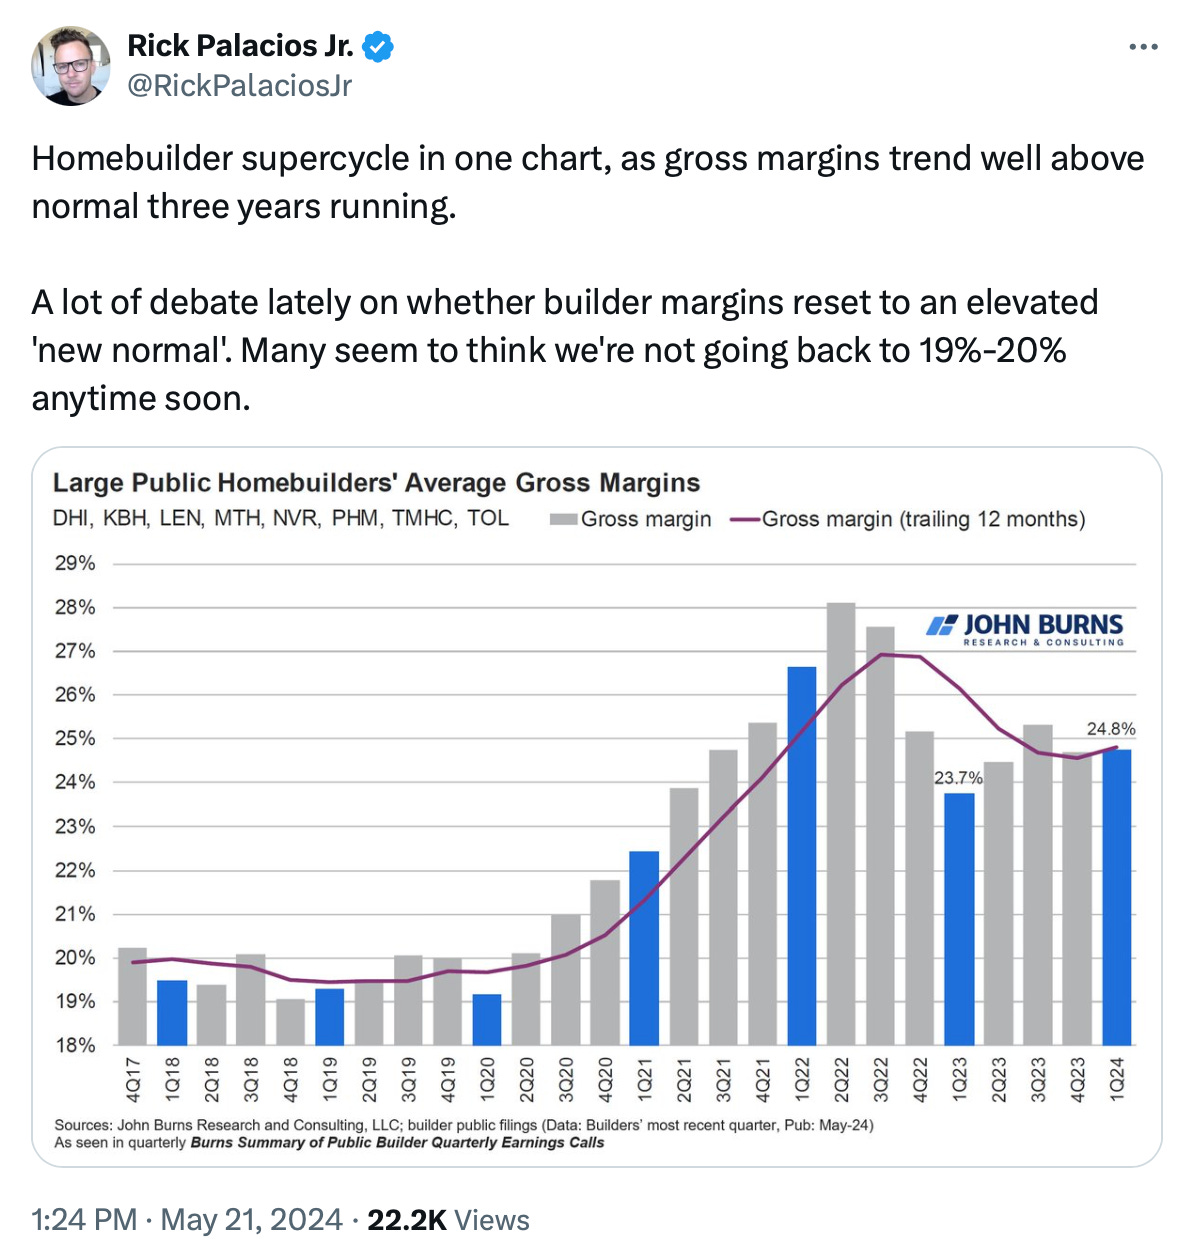
Home Builders Are Seeing High Margins
This means they can continue to offer rate buydowns which has remained a way to boost sales in a high rate environment. New construction only represents about 10% of the nation’s residential inventory but this advantage is something very difficult for existing home sellers to compete with.
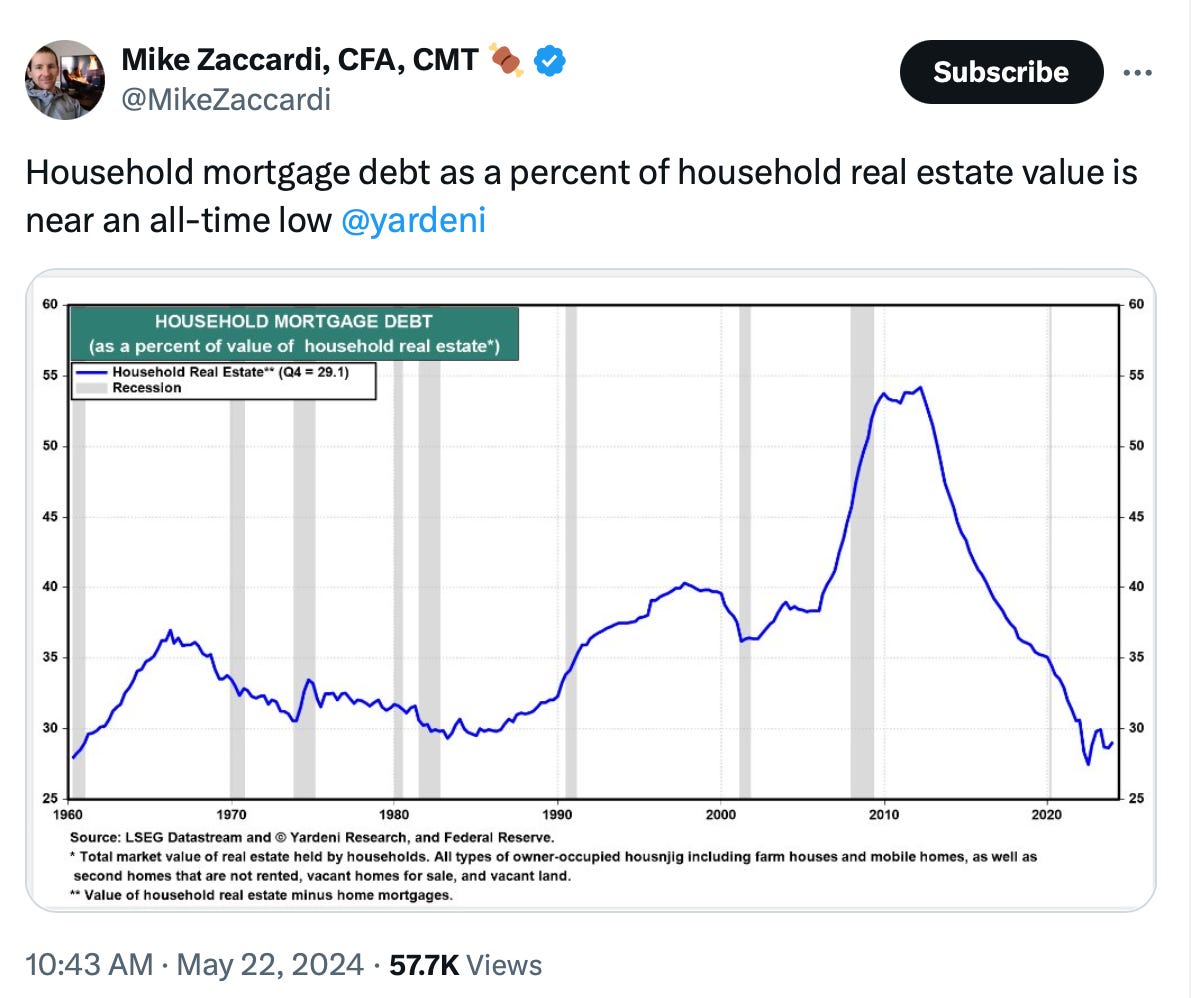
Although, household debt as a percentage of home value is at a record low – perhaps existing homeowners could compete with other existing sellers or new construction once they decide they need to sell. Just a thought.
Homeowner’s Insurance Is Most Expensive In Tornado Alley
The big three insurance threats seem to be:
Wildfire
Flood
Tornadoes
I would have thought it was flooding. Perhaps that’s a location-specific bias since I live near the water and have seen extensive Hurricane damage first-hand.
It’s High Costs After The Rate Of Inflation Has Subsided That Is Painting The Picture For Consumers
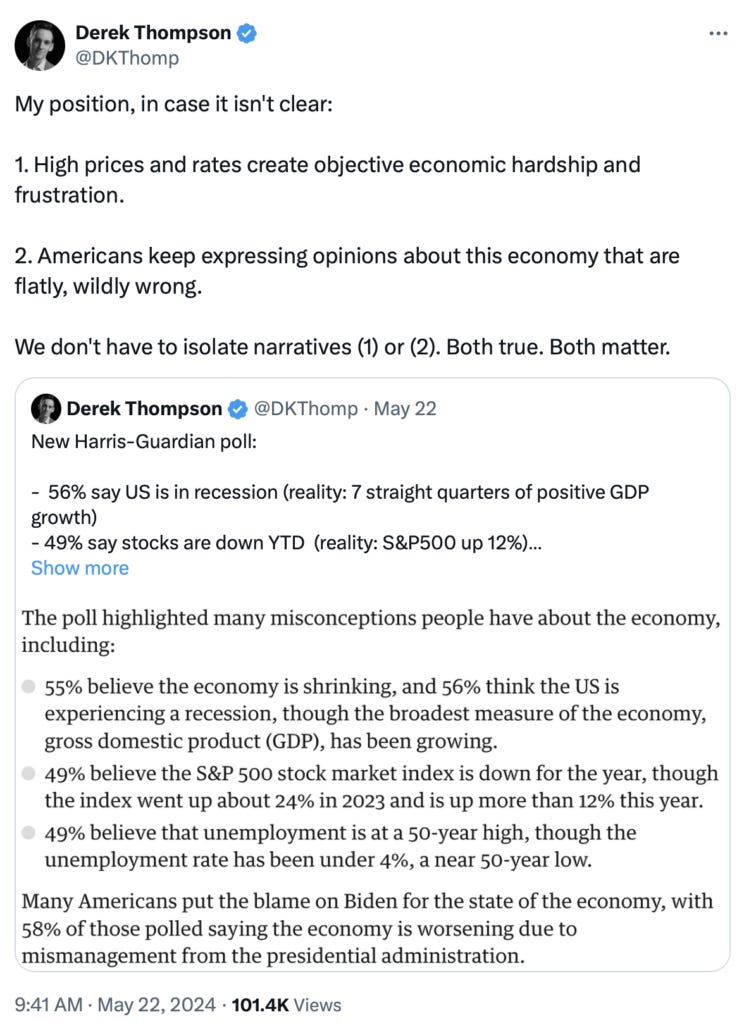
We’re in another post-pandemic confusion zone. Derek Thompson, a great explainer journalist lays out the caldron of political misinformation on the U.S. economy.
Mortgage Payments Are Absurd Right Now
My firm does the same thing for Manhattan and it helps us better understand the lower sales levels. I can only imagine the boom of pent-up demand when rates eventually settle to a modestly lower level.
Highest & Best Newsletter:

If you’re interested in the Florida housing market, you should sign up for this Florida newsletter, Highest & Best, from Oshrat Carmiel, formerly of Bloomberg News…
This week’s post:

Zeal of Fortune – Priciest home sale, housekeeper, fuel shed; Plus: J.P. Morgan South
Getting Graphic
Favorite housing market/economic charts of the week made by OTHERS
Apollo’s Torsten Slok‘s amazingly clear charts
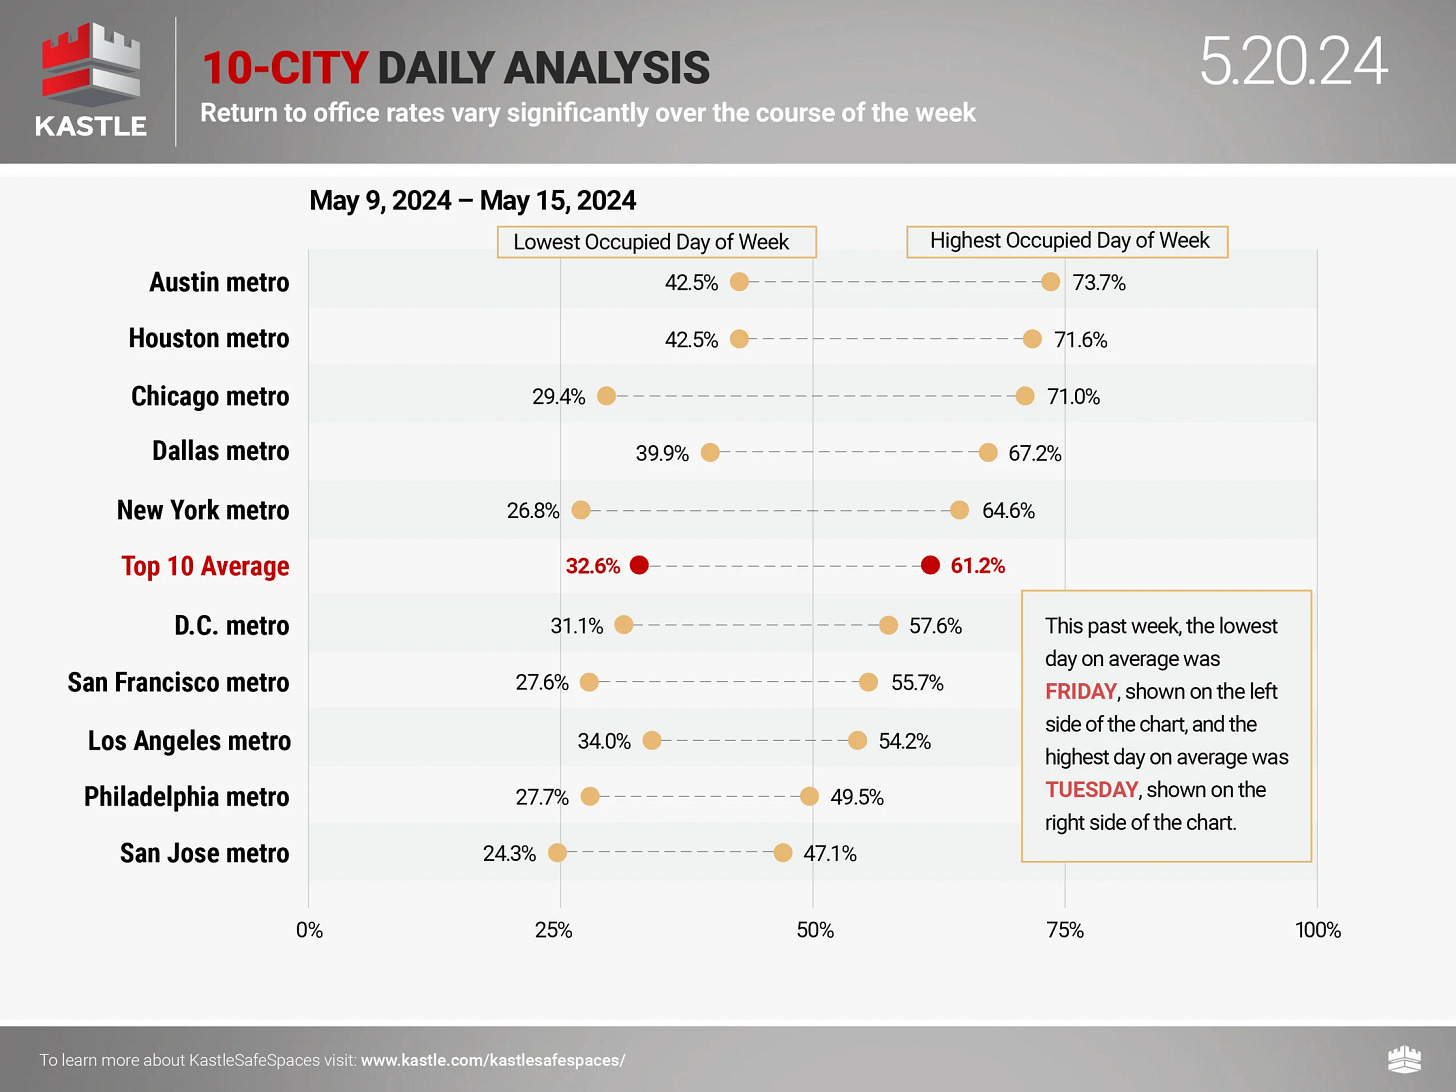
Kastle card swipe data
Remember that Kastle charts are overstating occupancy* because their pre-pandemic occupancy benchmark was 100%, which is incorrect (*measures card swipe activity as a proxy for occupancy). Still, they’ve become the standard benchmark for occupancy rates.
Favorite RANDOM charts of the week made by others
Appraiserville
As I mentioned last week, my passion project, Appraiserville will be moved to another location soon. Hang in there and have a great holiday weekend!
OFT (One Final Thought)
I have nothing this week as a former lobster fisherman.
Brilliant Idea #1
If you need something rock solid in your life – particularly on Friday afternoons at 2:00 PM, Eastern Time (ET) – and someone forwarded this to you, you can sign up here for these weekly Housing Notes. And be sure to share with a friend or colleague if you enjoy them because:
– They’ll find the seafood lobster in you;
– You’ll remember that I am a lobster fisherman at heart (really!);
– And I’ll be lost.
Brilliant Idea #2
You’re clearly full of insights and ideas as a reader of Housing Notes. Consider sharing them with me early and often. I appreciate every email I receive, as it helps me craft future Housing Notes.
See you next week!
Jonathan J. Miller, CRE®, Member of RAC
President/CEO
Miller Samuel Inc.
Real Estate Appraisers & Consultants
Matrix Blog @jonathanmiller


