

Homeownership Is Not A Given And It Can Be Taken

US Homeownership Rate Is 65.6%, Similar To The Monthly Average Since 1965
The 5% Surge In US Homeownership During The Housing Bubble Caused A Foreclosure Surge
New York State Has The Lowest Homeownership Rate While NYC Is Only 30%
Over the past few years, many consumers have been thinking about the rent versus buy decision with elevated mortgage rates (relative to the pandemic era) and high rental rates. The U.S. average homeownership (HO) rate from January 1965 through April 2024 was 65.3%, about the same as the latest result available of 65.6% last April.
The 2020 Spike In The Homeownership (HO) Rate

Blame the pandemic. The combination of the drop in mortgage rates and the surge in home sales coming out of the lockdown in the spring of 2020 caused the homeownership rate to spike to 67.9%. However, the Census survey data was very limited during the pandemic, so I’d be skeptical of the high rate.
The 1995 to 2005 Increase In Homeownership Cost The U.S. A Lot
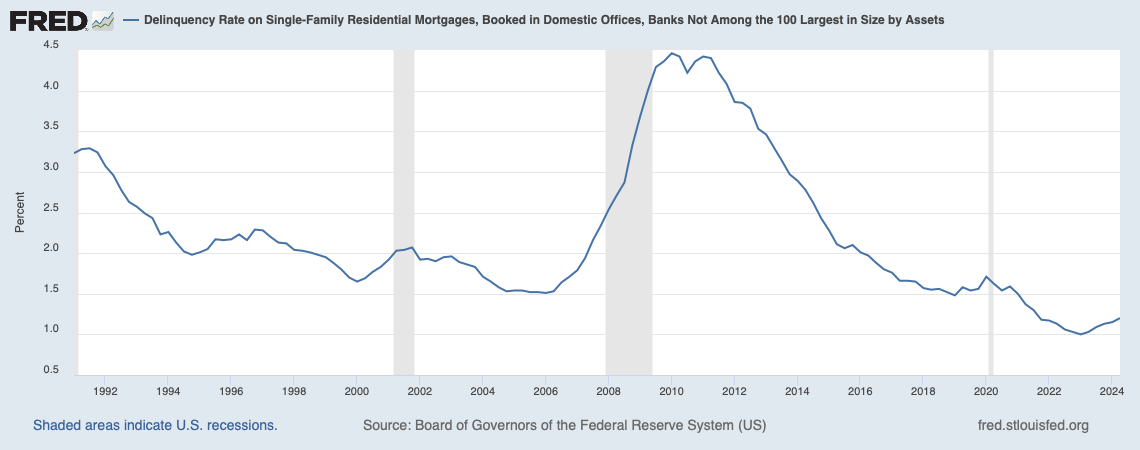
The 5% surge in the formerly steady 64% homeownership to 69% homeownership by 2004 was enabled by Wall Street’s financial engineering of the mortgage space. All the bad stories we’ve heard for years that, in hindsight, sounded insanely stupid, but that’s the poisonous group-think that exists when everyone is making money and doesn’t want the music to stop. U.S. foreclosures surged from 2008 to 2012. Think about Washington Mutual (WAMU) and its idiotic “Power of Yes” advertising campaign. I knew several people at WAMU who couldn’t believe how dumb the bank’s advertising slogan was. It was consistent with their 2006 efforts to shut down all appraisal review functions so that all mortgage applications would be approved. I remember live blogging the moment WAMU shut down their appraisal review departments. It was as hard to believe then as it is now in retrospect. Thankfully, the delinquency rate now is much lower than the pre-housing bubble norm because banks never lost their underwriting minds during the pandemic era.
New York State Has Lowest Homeownership In The U.S.
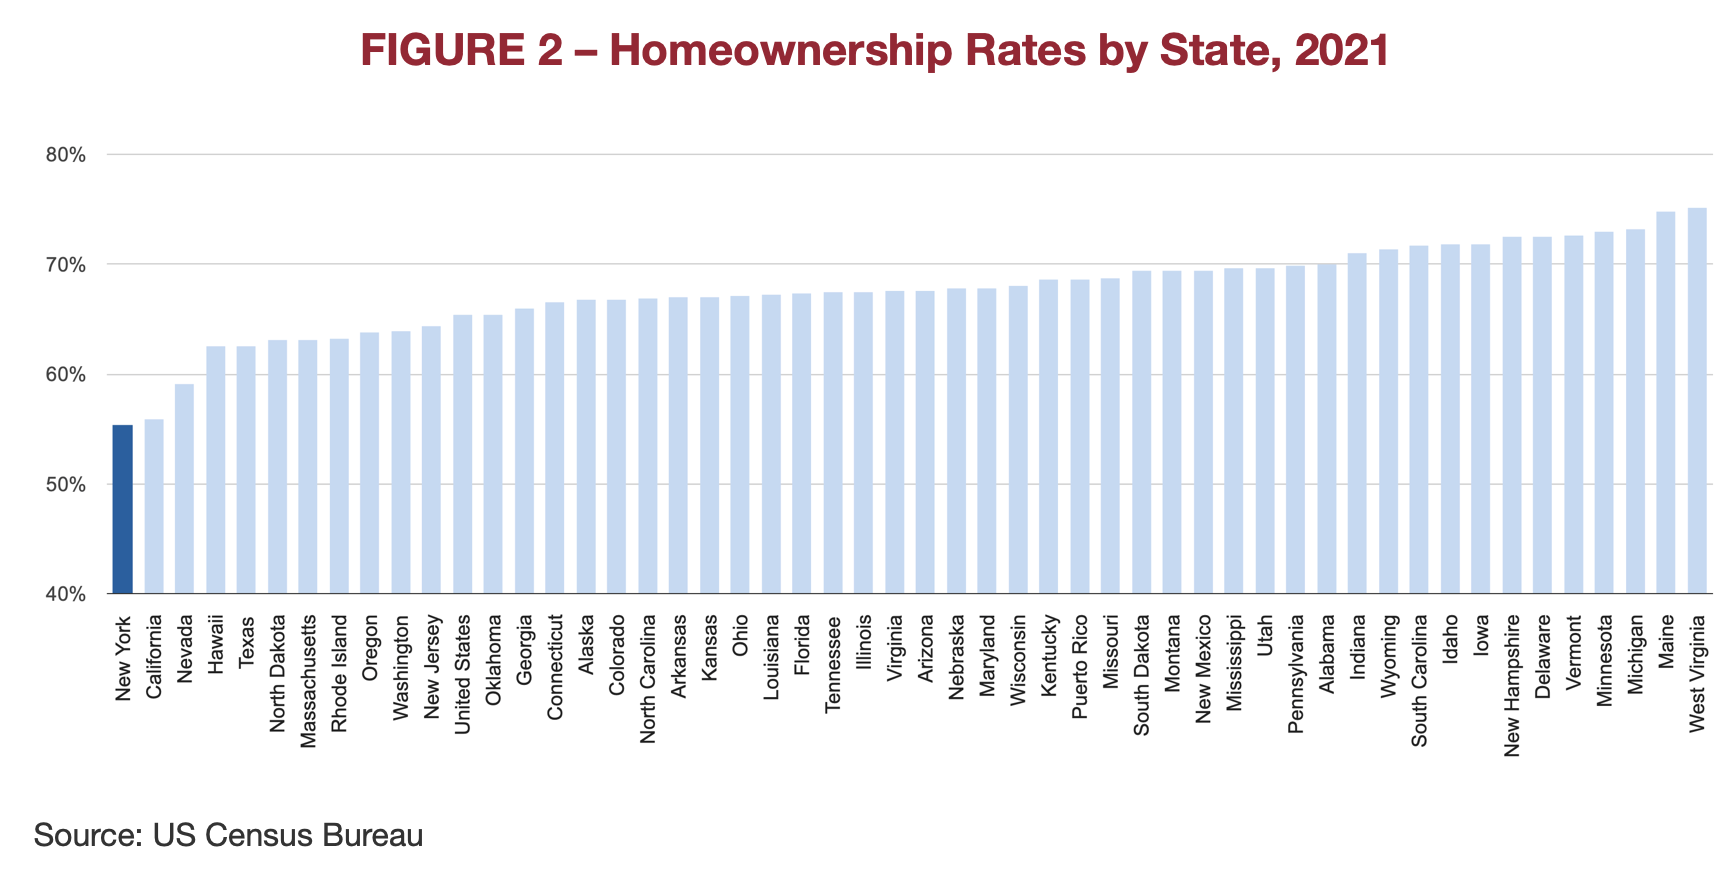
Because housing prices in the state (mainly due to NYC itself) are the highest in the U.S., the New York State HO rate is the lowest in the nation. The HO rate in NYC is only about 30%. While this 2015 homeownership data is dated back in 2015, rural areas had a homeownership rate of 83.8% while urban areas had a 59.8% rate.
Using ‘Rent Versus Buy’ Formulas To Decide
Every situation is unique, and not all consumers should be homeowners, nor should they rely solely on formulas. It’s definitely something that is pushed by federal policy and tradition, but it’s not for everyone. One of the issues with the housing bubble was that Wall Street incorrectly thought it could manage mortgage risk but was using the wrong data. Their thinking turned out to be that if you had a pulse or could fog a mirror, you could be a homeowner. The spike in foreclosures in 2009 proved empirically that that thinking was wrong. Here are some ways to look at the question.

The New York Times Rent-Versus-Buy Calculator was updated and included this helpful caveat:
“Ultimately, the calculator can’t tell you whether you should rent or buy. That decision depends on the future paths of home prices and rents, which are unknowable. It also depends on your life stage — a factor that too many people fail to consider when making this decision. If you know you will move again a few years from now, for instance, buying is almost certainly a mistake.”
The 30/30/3 Rule – this rule seems hilariously out of whack in the New York metro area, but it was popular before the pandemic when rates were falling.
The 5% Rule also seems hilariously outdated.
“The 5% rule, when comparing renting and buying a home, suggests that it may be more financially advantageous to buy a home if the annual cost of owning the property, including mortgage payments, property taxes, and maintenance, is less than 5% of the property’s purchase price.”
The 8.71% Rule – this is a modification of the 5% rule.
“Take the home price, multiply it by 8.71%, and then divide by 12. This gives you an estimated monthly cost of owning that home.”
Final Thoughts
If you know me, you know I hate rules. The three “rules” that I listed are commonly shared in personal finance columns but the many variables in homeownership are so wide the rules are like reading a horoscope for life advice. I think it’s more about being realistic about the time you plan to stay in the home and how much it would cost with current financing versus how much you’d pay for a rental you could envision living in. I’m a big believer in homeownership, so I have an inherent bias. I’ve experienced bidding wars and never paid under the list price for a home in the past 30 years/three houses, but I am still convinced it’s been a good decision every time.
We are publishing our NYC rental analysis for September a week starting today.
To help explain me to my readers, this carton show premiered on the very day I was born.
AN ASIDE
Urban Digs: Awakening from Market Hibernation with Jonathan Miller

Did you miss yesterday’s Housing Notes?

October 2, 2024
Manhattan Cash Share Falling As Mortgage Rates Fall
Image: ChatGPT