Time to read [4 minutes]
Takeways
- Higher-priced NYC boroughs saw meaningful increases in sales, while the three lower-priced boroughs recorded fewer sales, reflecting greater interest-rate sensitivity for lower-priced buyers.
- Manhattan has not set new price records and its prices have moved sideways for nearly a decade.
- Listing inventory has been generally flat or falling since the pandemic, unlike much of the US.
Chart Warning (there’s a lot) – Every quarter, I publish a broad summary of residential housing performance (Co-ops, Condos & 1-3 families) for all of NYC and each of the five boroughs. Three of the five boroughs are already part of the Douglas Elliman market report series, and the remainder I do for fun. Since I was already analyzing a chunk of the largest city in the US, I decided I could do the whole thing too. The Miller Samuel New York City Market Brief 3Q 2025 is already online, with one-, two-, and three-year comparisons by borough and the whole city. The two most expensive boroughs saw a meaningful increase in sales. The lower-priced remaining boroughs saw record pricing but a drop in sales, as lower-priced purchasers tend to be more interest-rate-dependent. The yellow highlights are price records. The only borough without a price record was Manhattan, which has been flat for largely a decade.
NYC Price Charts
The spread between average and median sales prices is widening, indicating the rising share of high-end real estate.
Manhattan has not seen the price growth of the other four boroughs over the past decade.
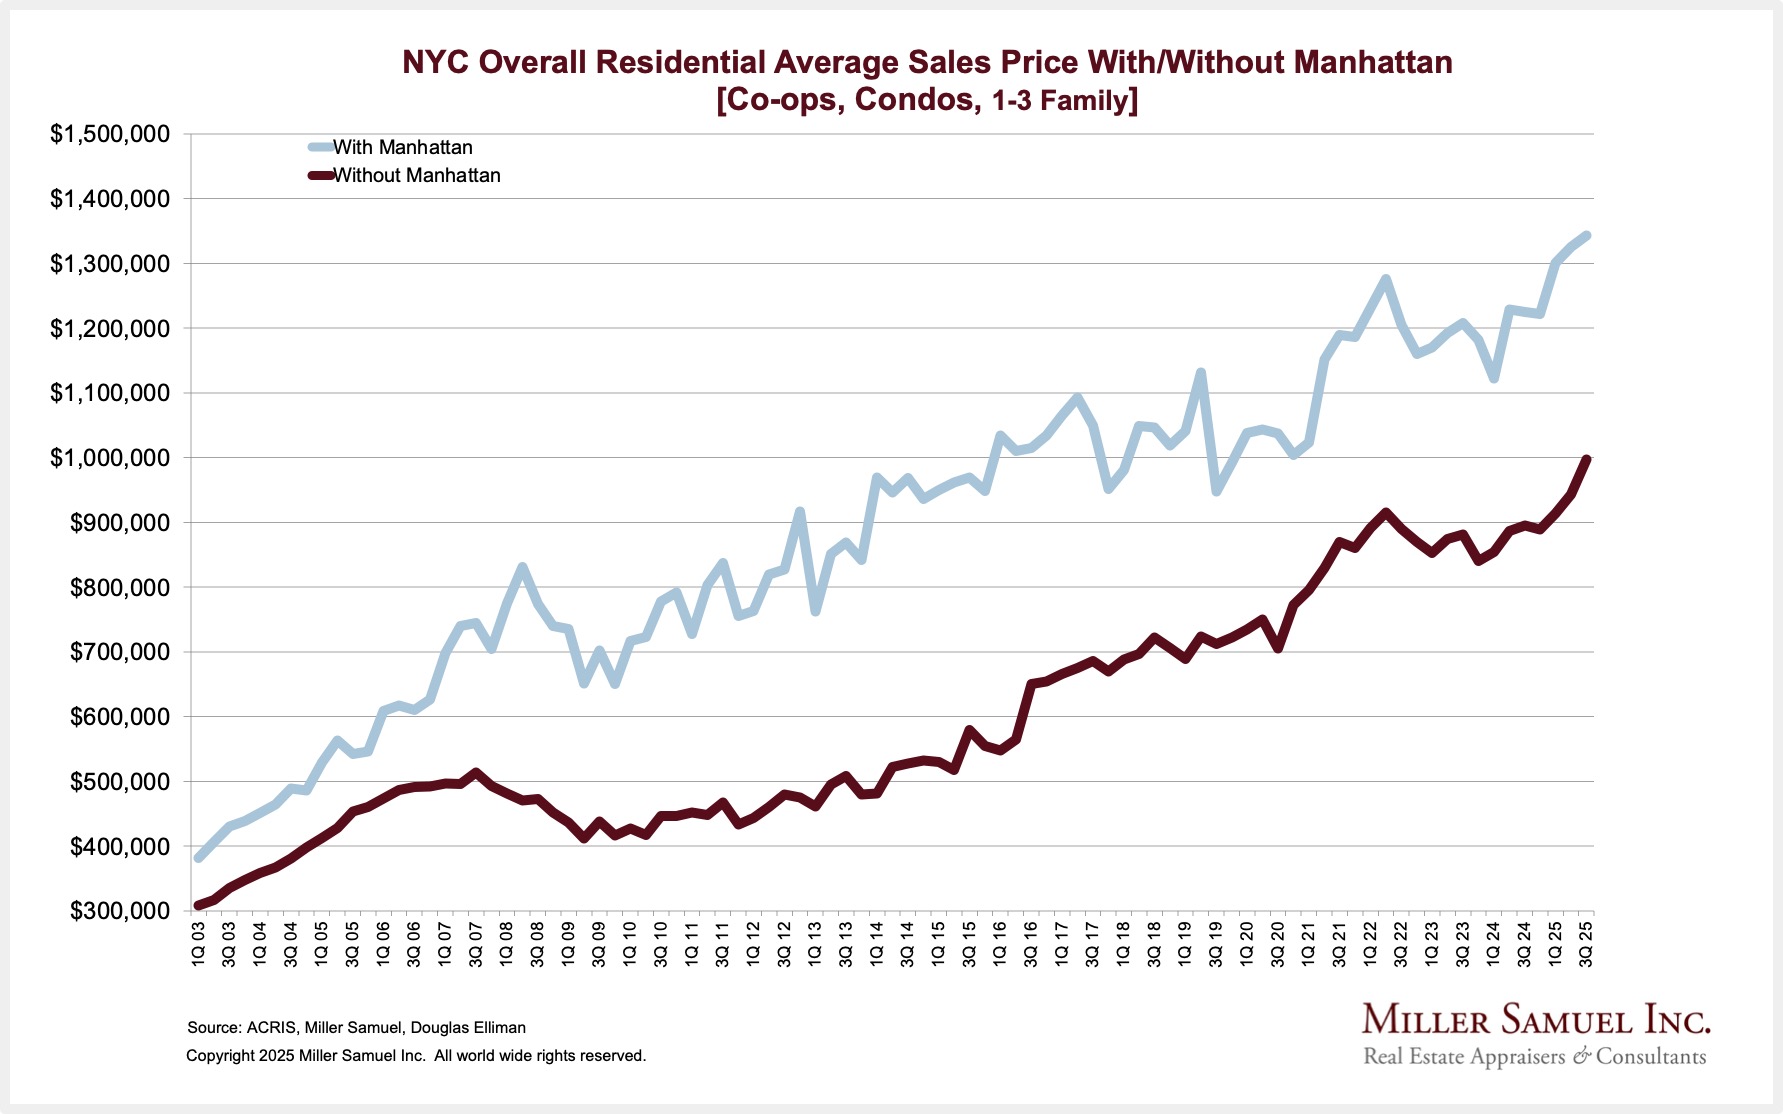
While the trends are the same after removing Manhattan from the NYC average sales price calculation, it is clear that Manhattan plays a significant role.
NYC Sales Charts
Sales in the three highest-priced boroughs are rising faster than in the remaining two (lowest-priced boroughs). All saw a surge in sales after the pandemic, which was more pronounced in the higher-priced boroughs.
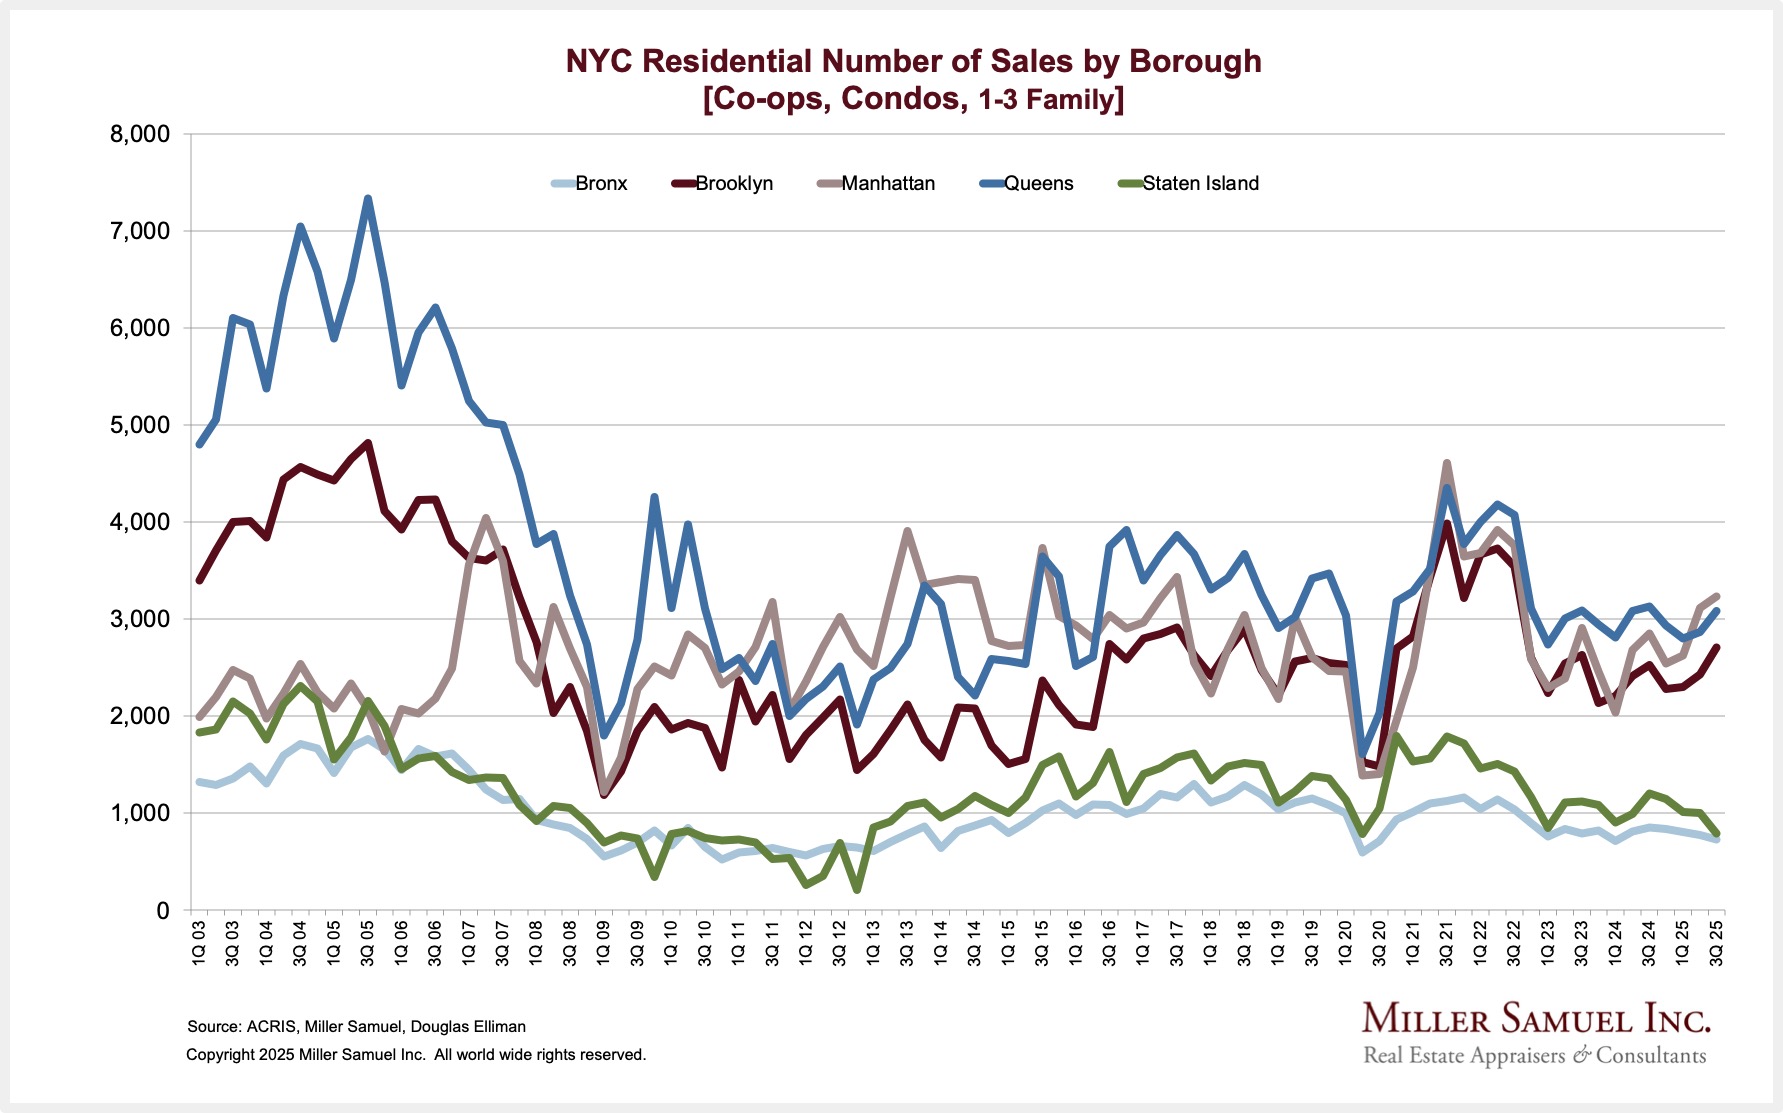
Sales in the three highest-priced boroughs are now rising.
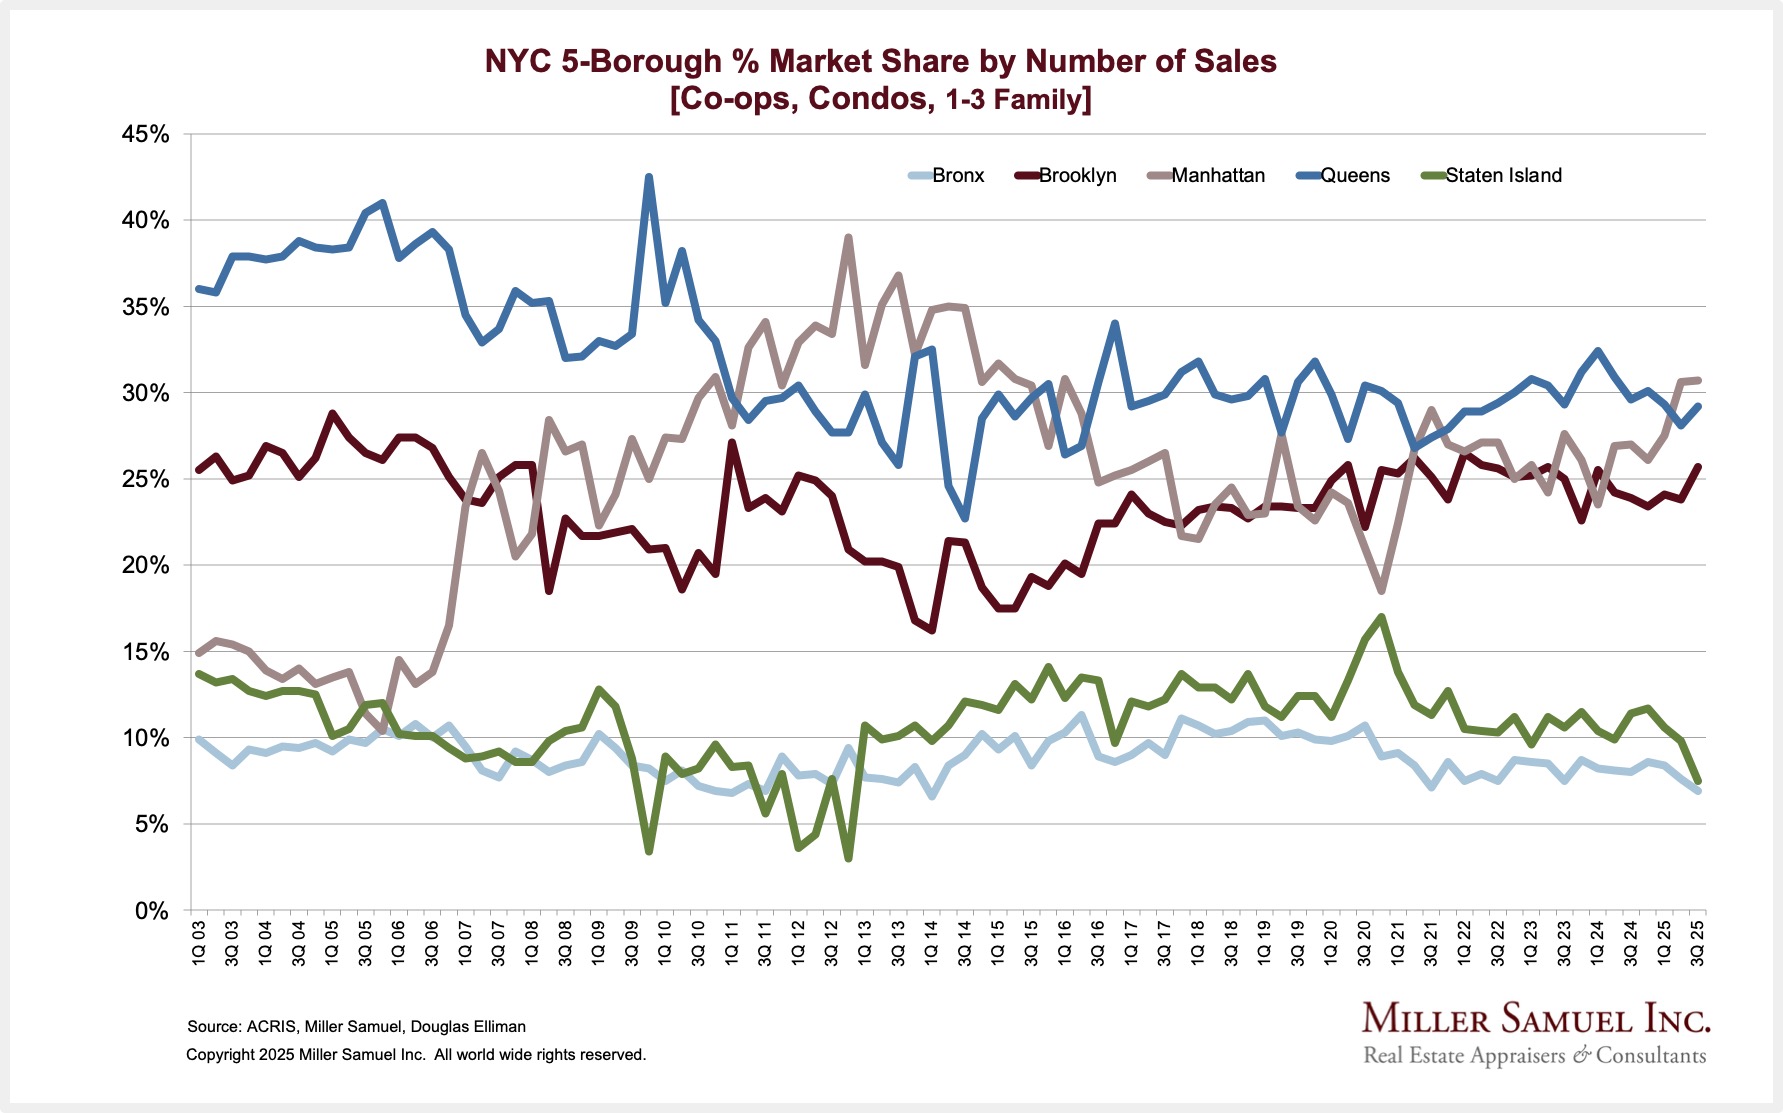
The market share by units sold shows the gap widening between the higher-priced and lower-priced boroughs.
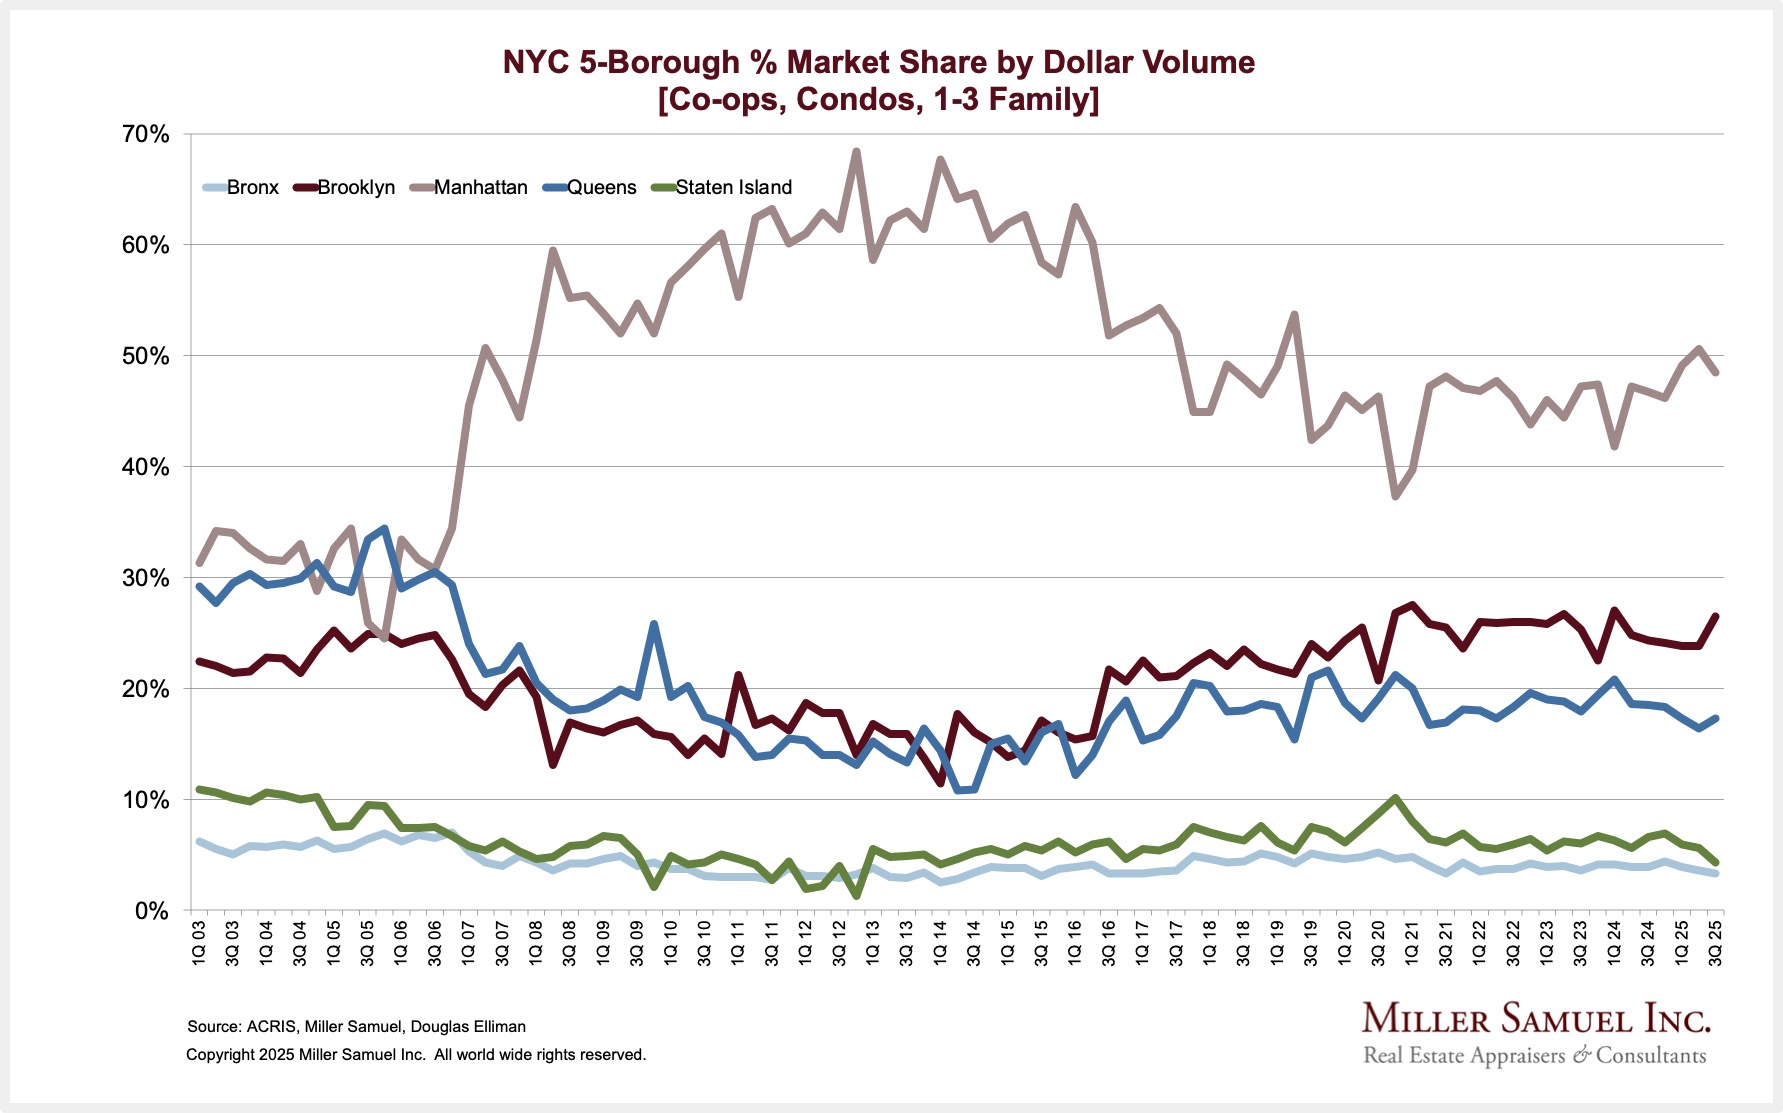
The market share by dollar volume shows that post-pandemic, Manhattan and Brooklyn are growing faster.
NYC Inventory Charts
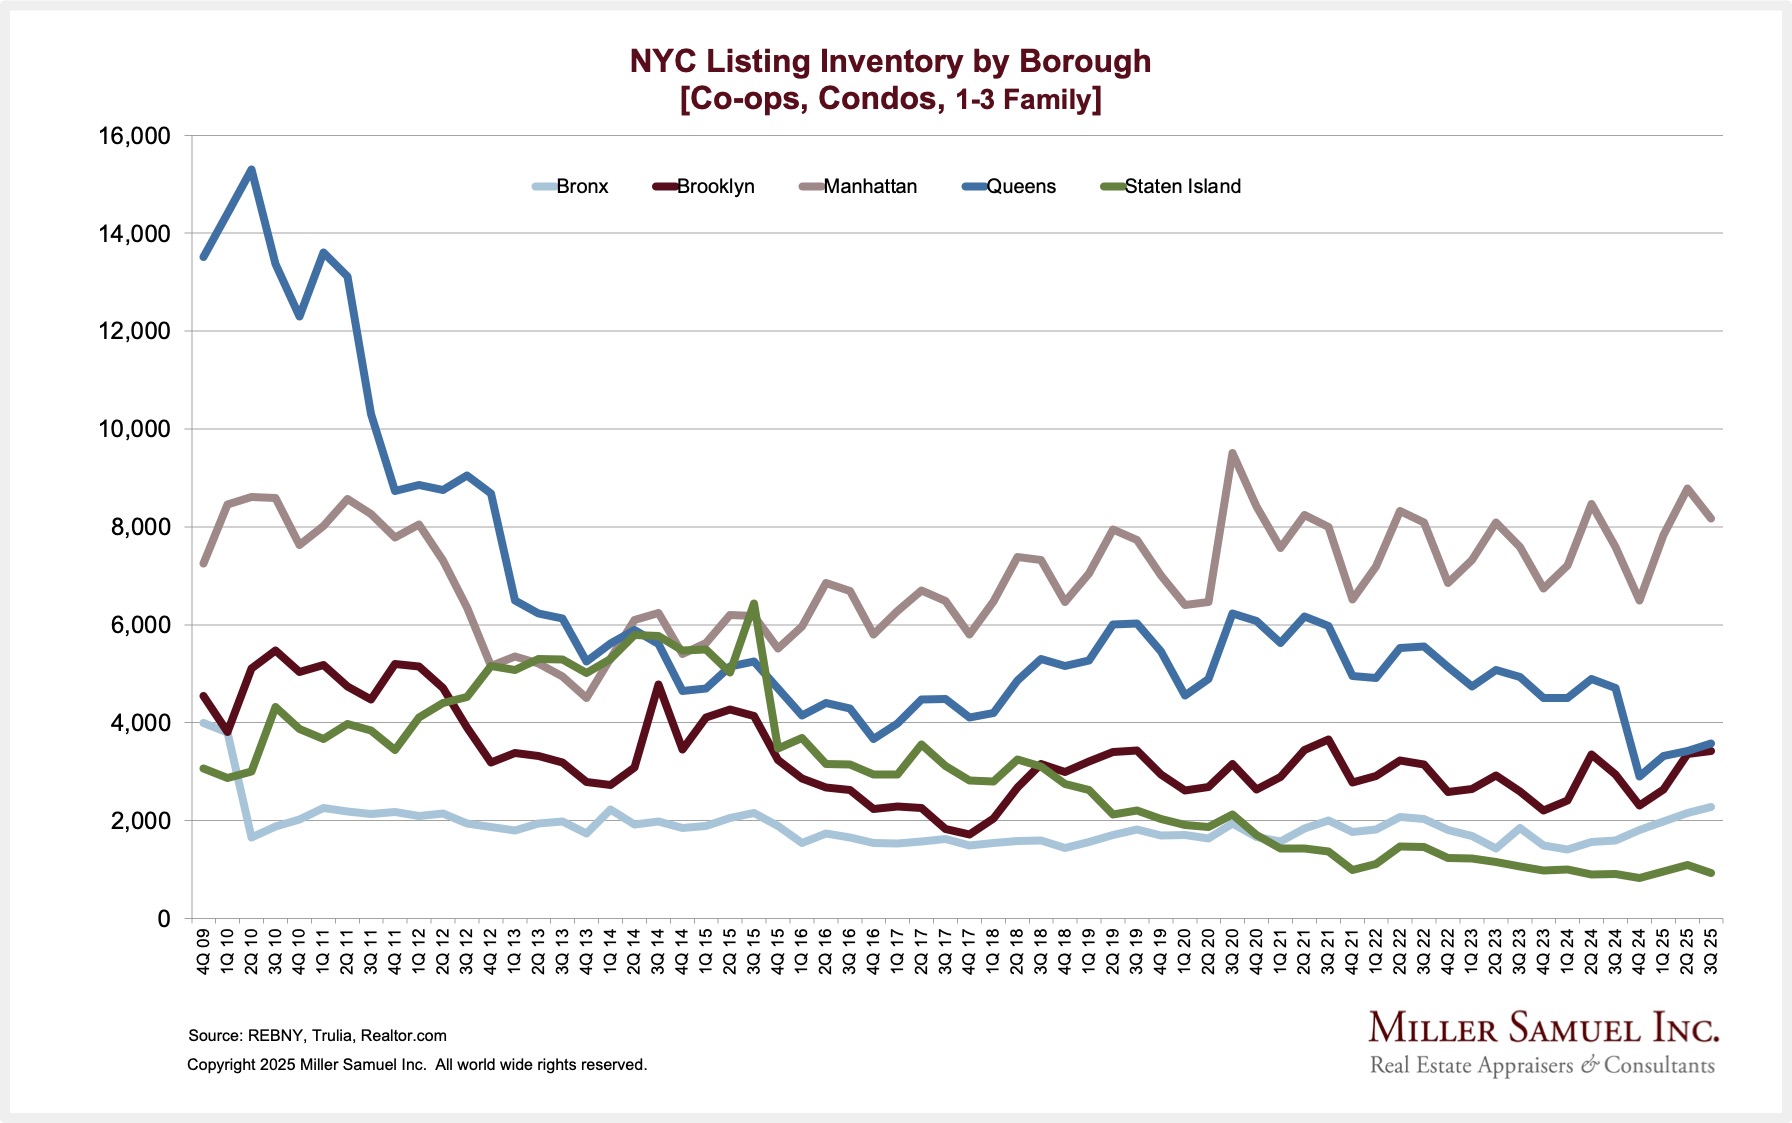
Listing inventory has remained generally flat to falling coming out of the pandemic.
Final Thoughts
The New York City residential market in 2025 saw robust activity, with the two highest-priced boroughs posting significant sales gains, while the three lower-priced boroughs reached new price records but experienced fewer sales due to greater interest-rate sensitivity among buyers. Manhattan’s prices remained essentially flat after a decade of stability, contrasting with notable growth in the other boroughs and driving a widening gap between average and median citywide prices.
Listing inventory citywide remained generally flat or declined, and higher-priced markets continued to lead post-pandemic growth, capturing a greater share of sales and dollar volume.
The Actual Final Thought – An incredible stat about lost inventory (NSFW).

Did you miss the previous Housing Notes?
November 18, 2025
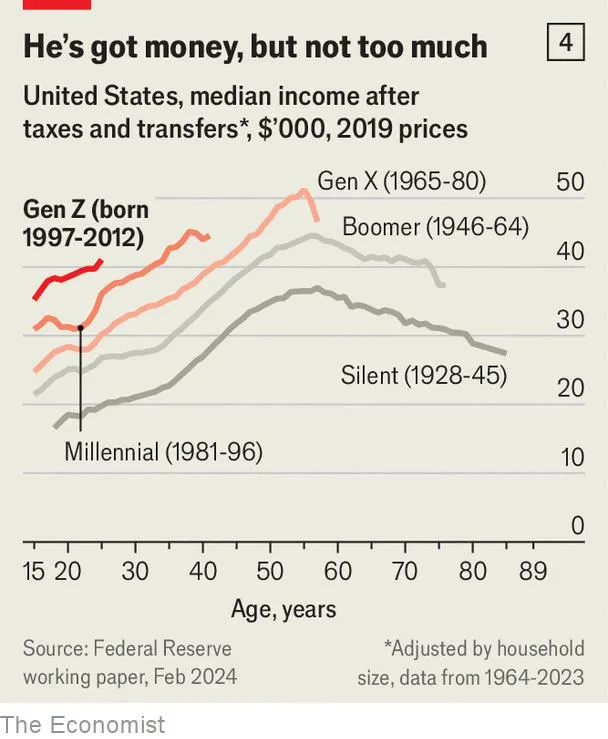
‘Stop Buying Lattes’ As The Path To Homeownership And Other Myths
Image: The Economist