

DOM: The Market Doesn’t Care What Price You Want

Time to read [5 minutes]
Takeways
Using our data, Manhattan and Orange County listings sold faster than their decade averages, while Miami was equal to the long-term norm.
Focused on the last list price before closing with the understanding that excessive listing discounts correlate with longer selling times
Sellers who overprice are typically seen as unreasonable, causing listings to linger and potentially reducing interest in the property
This morning, I took a look at three cities I track in the Douglas Elliman market report series I’ve been authoring since 1994. The premise was to understand how much overpricing impacts the length of time a listing sits on the market. The second step not covered here is to consider how excessive pricing would affect the final sales price. I had partnered up with the NYU Furman Center, but the other band members moved on to other ventures after we published our first paper. To prevent this post from being too wonky, I only considered the last list price before a listing sold, rather than the original list price and all the subsequent cuts. I also focused on closing data rather than contracts for two reasons. Firstly, pricing for contract data isn’t generally available, and secondly, NAR data suggests that prices fall on average by 2% from contract date to closing date. The market hasn’t tested the original list price, and the last list price reflects the moment a listing entered the market and was finally sold. One of the frustrations felt by many real estate agents occurs when a seller says (I’m paraphrasing something I was told a seller said at a speaking engagement in Westchester County, NY), “Lets test my obviously wildly high dream price and if it doesn’t sell, we’ll drop the price to something reasonable. What if a Middle Eastern sheik wants to buy my raised ranch in this 1950s subdivision for double what it is worth for cash?” My quick response would be: “Have you ever heard of the Internet?” For the following analysis, I looked at the most recent data I had for Manhattan, Miami, and Orange County, and the results were quite different by region. Here is the NAR table that inspired this Housing Note.

Explainer Wonk
Days on Market (DOM) – The number of days from the last listing date to the closing date – not the usual contract date to capture price changes from contract to closing date.
Listing Discount – The percentage difference between the last asking price and the closing price.
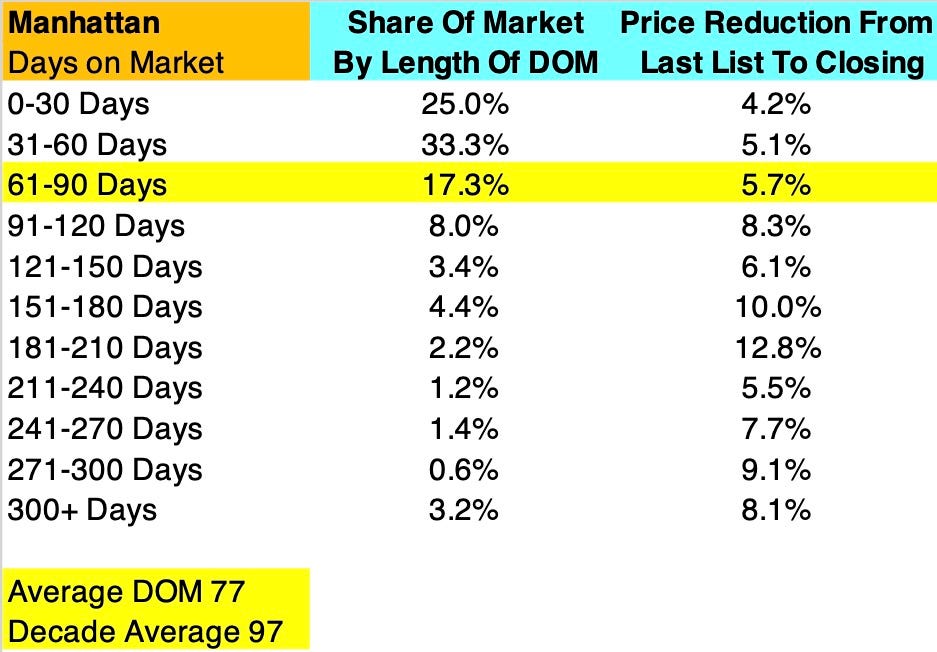
For each of the following tables, we broke out the market share of closings that occurred in each DOM strata. The yellow bar represents which segment includes the marketwide average days on market.
I compared the DOM average for the decade to the current DOM to determine how the current market compares to the long-term norm.
Manhattan DOM – Faster Than Decade Average
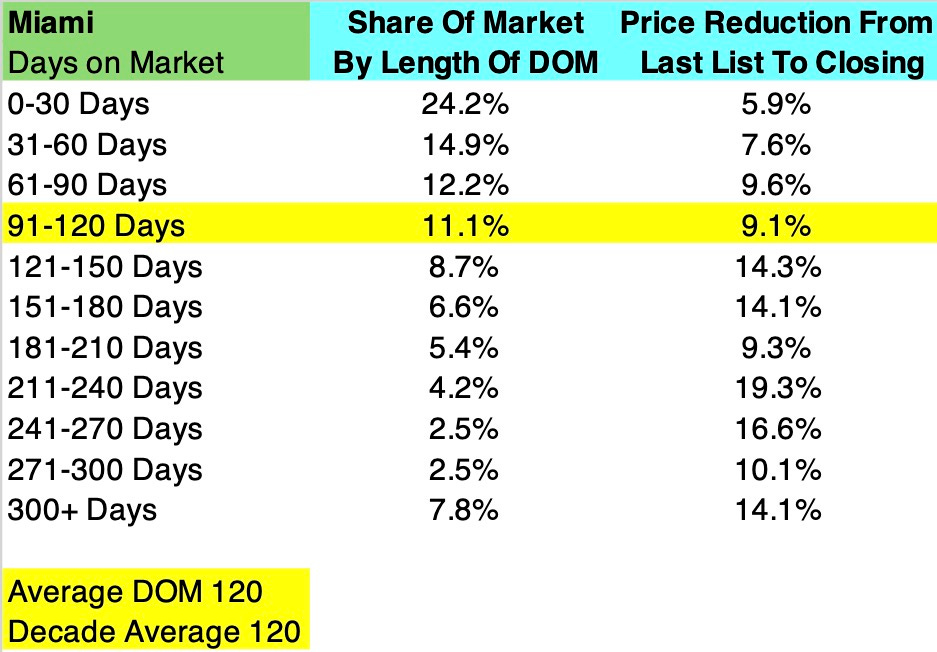
Miami DOM – Equal To Decade Average
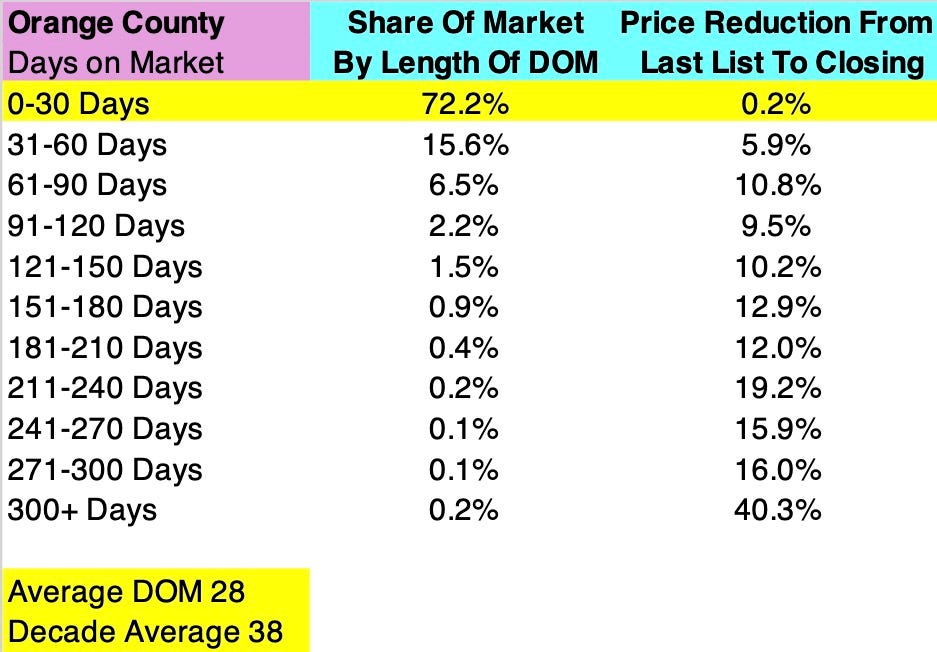
Orange County DOM – Faster Than Decade Average
Final Thoughts
After reviewing the results of the three markets, it is clear that asking prices that require larger discounts tend to make the listing take longer to sell. What’s missing from this analysis is whether overpricing damages the property’s value in the market. Overall, it does from my experience. When a property is significantly overpriced, that seller is viewed in the market as unreasonable, and may influence consumers to consider skipping the house altogether.
An essential rule of thumb is that the market doesn’t care what price the seller wants, and a wildly overpriced listing often never sells.
The Actual Final Thought – Remember that pricing theory can provide some “help” and can go quite deep, even to purple.
[Podcast] What It Means With Jonathan Miller

The Housing Is Good To The Last Drop episode is just a click away. The podcast feeds can be found here:
Apple (Douglas Elliman feed) Soundcloud Youtube
Did you miss the previous Housing Notes?
October 10, 2025
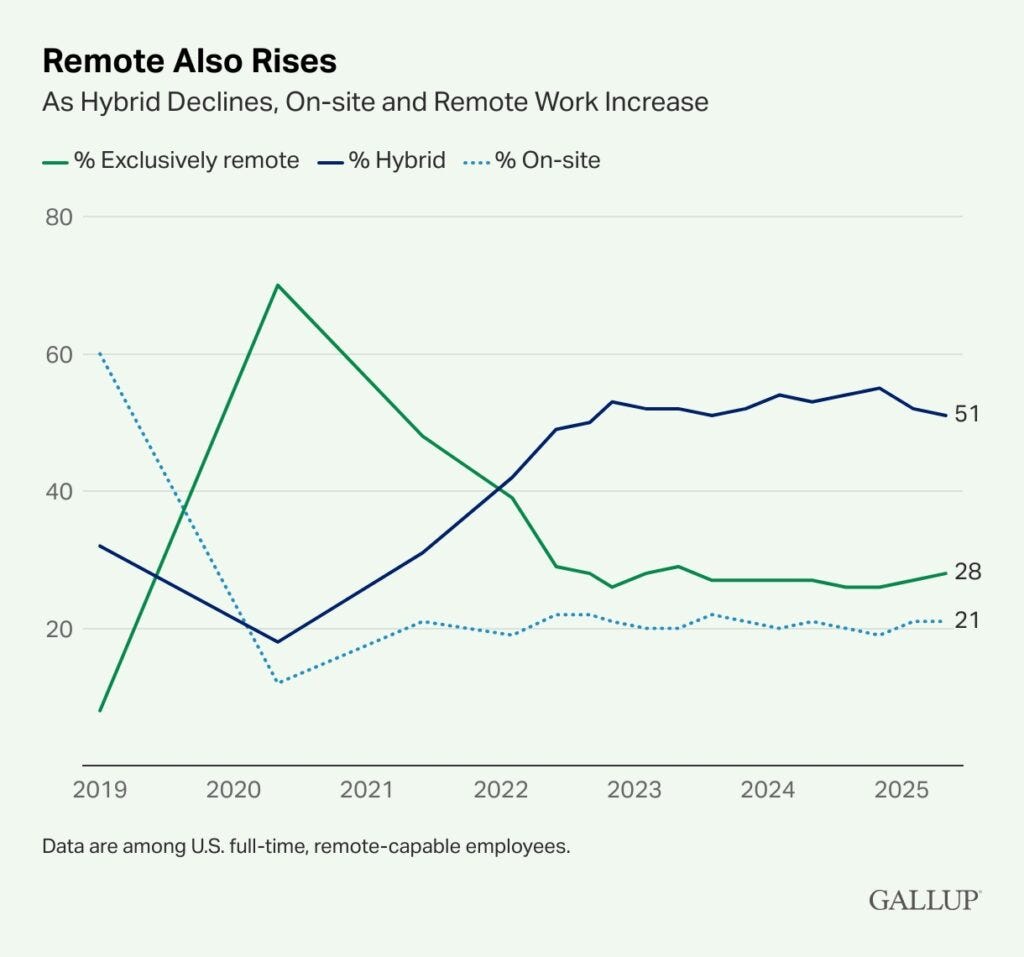
Screams For RTO Are Only Being Made By Those With Vested Interests
Image: Gallup