- Manhattan Sales Are Rising – Both Re-Sales And New Development
- Manhattan New Development Is Leading The Market
- Manhattan Re-Sale Price Trends Remain Weak
Today’s Housing Notes is an explainer to make sense of the Q4-2024 Manhattan Market Report: Last week, we released it, and it showed polarizing results. By the way, Manhattan Sales was the first market report series I created way back in 1994 (30 years ago!) Re-sales versus new development sales told very different stories as we head into the new year. (By the way, no one is allowed to wish you a Happy New Year after today.) By the way, I’m obsessed with Honeycrisps.
The Manhattan New Development Market
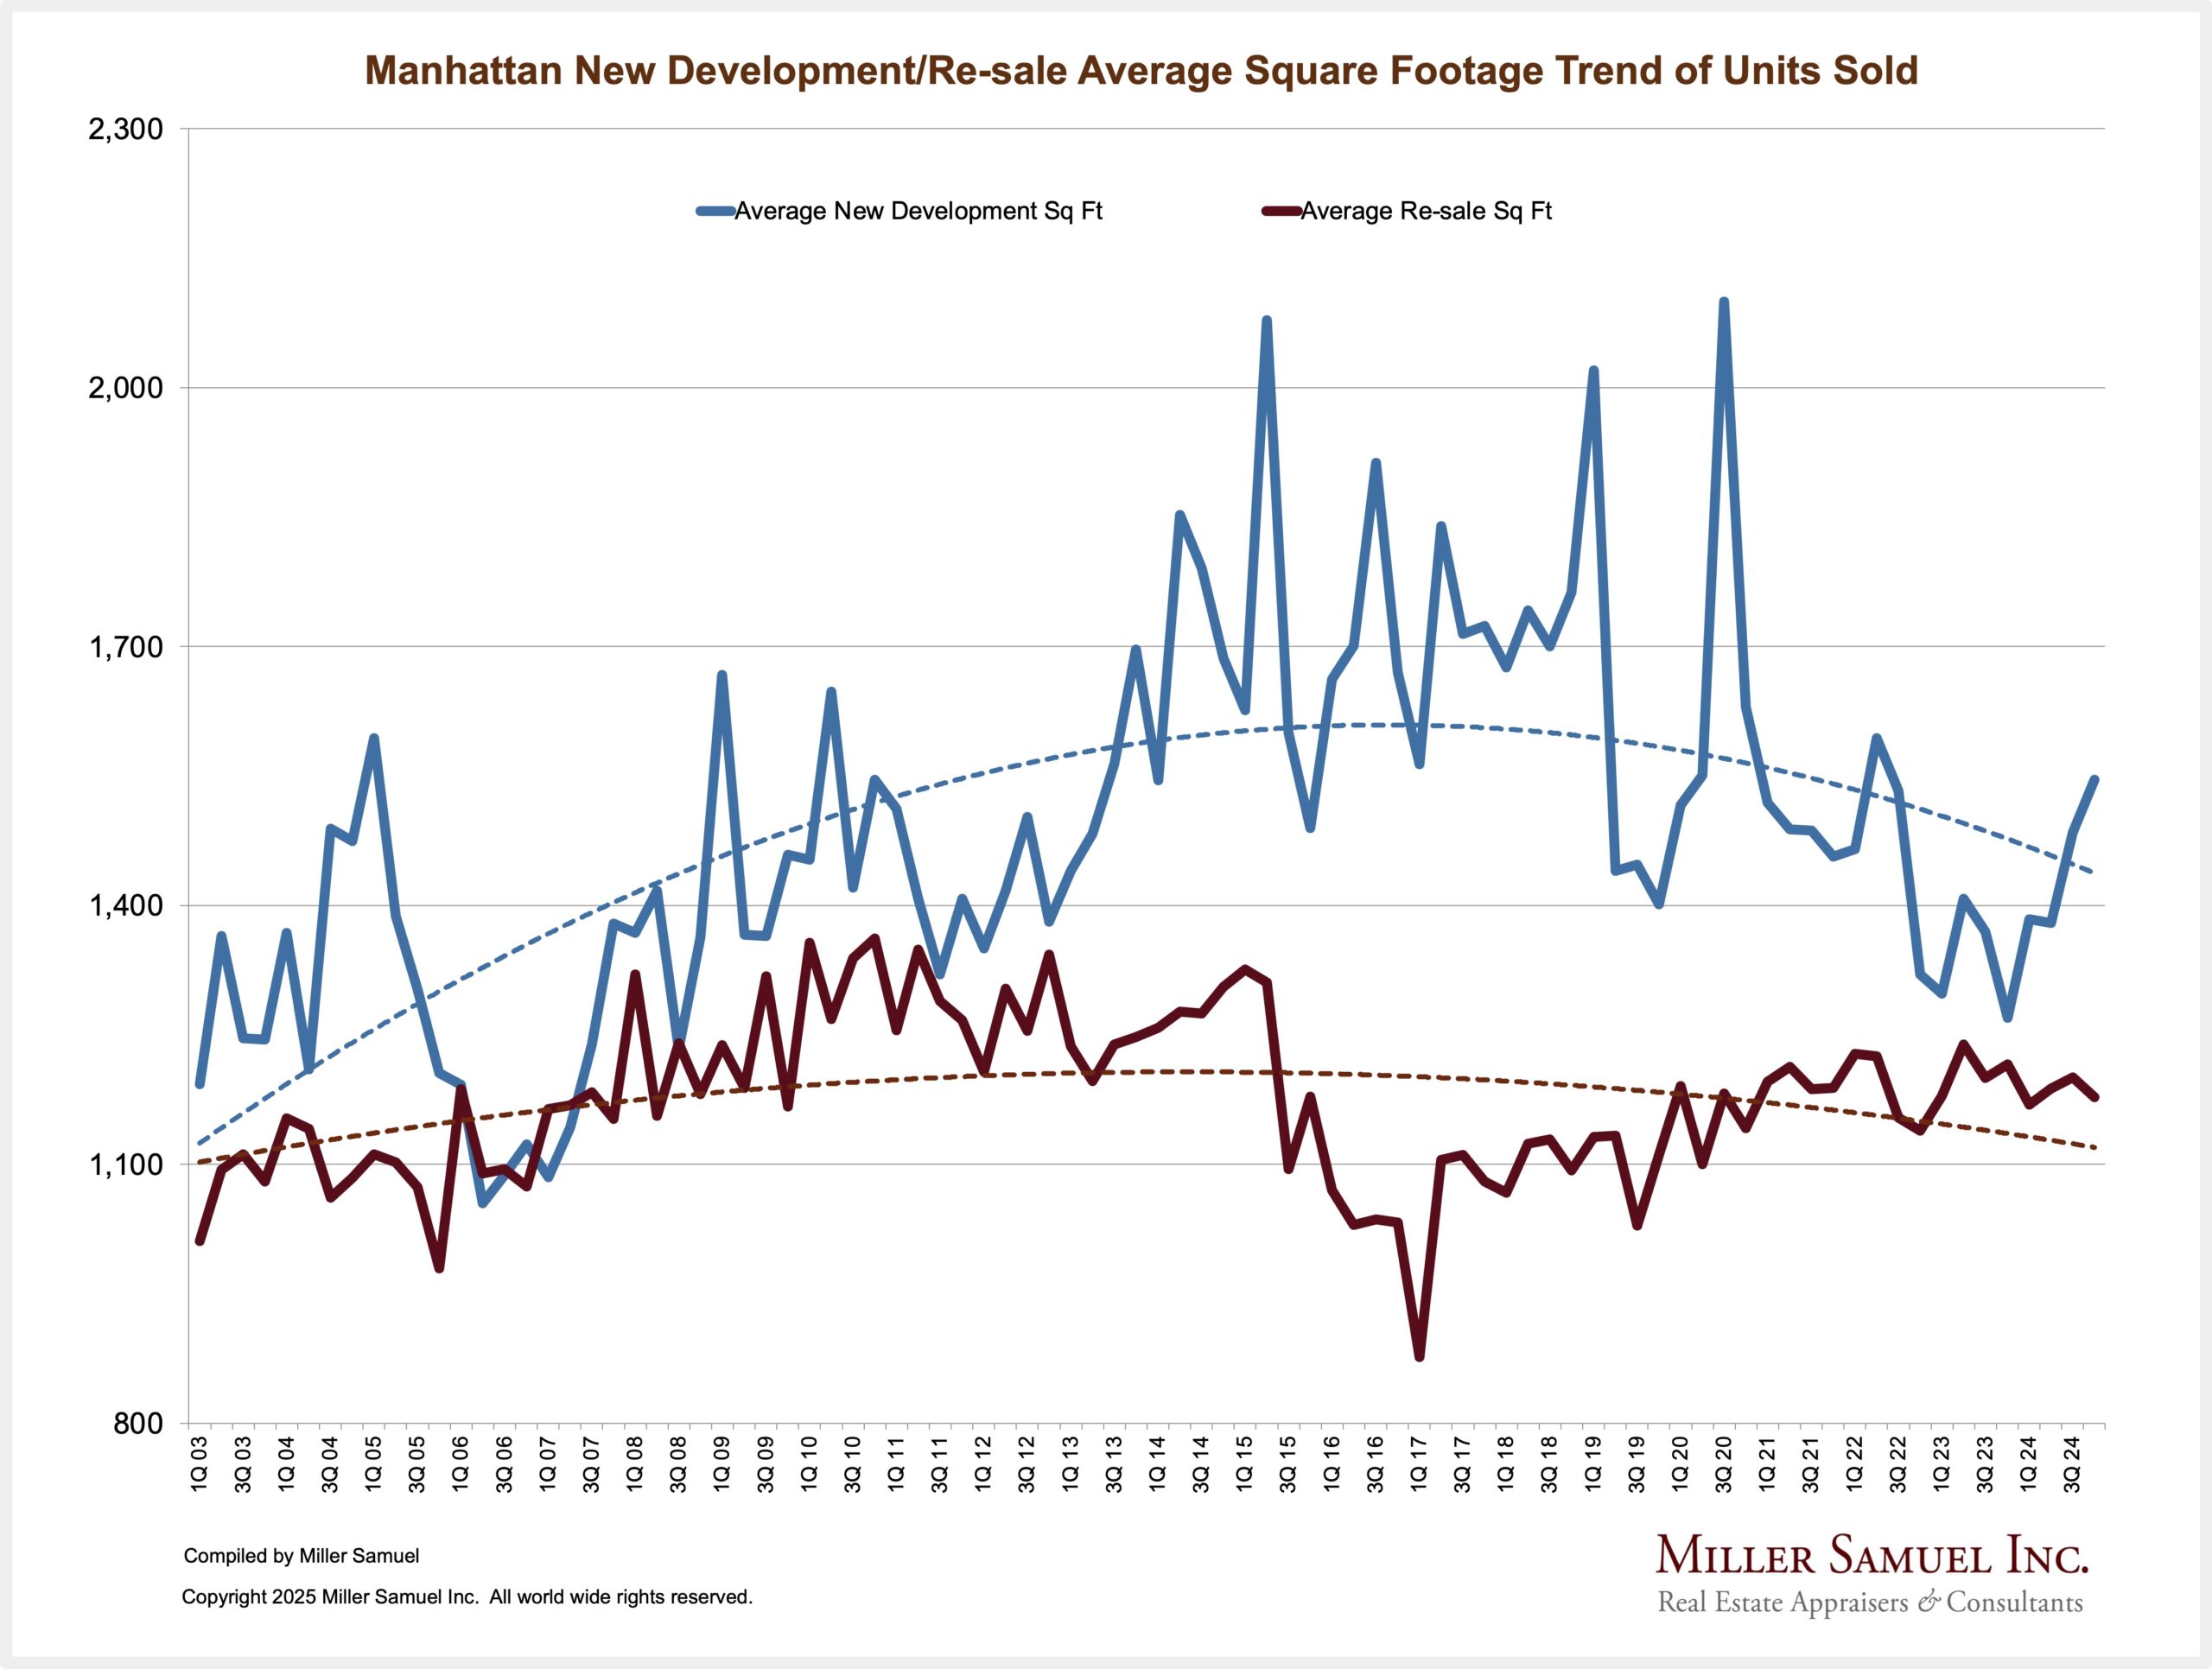
While the macro trend of sales is skewing smaller in the search for affordability, the short-term trend for new development (new construction in the national context) has shown a recent sharp upward skew in sales size. The average size of a newly constructed condo sold was 1,546 in the fourth quarter, 21.7% larger year over year.
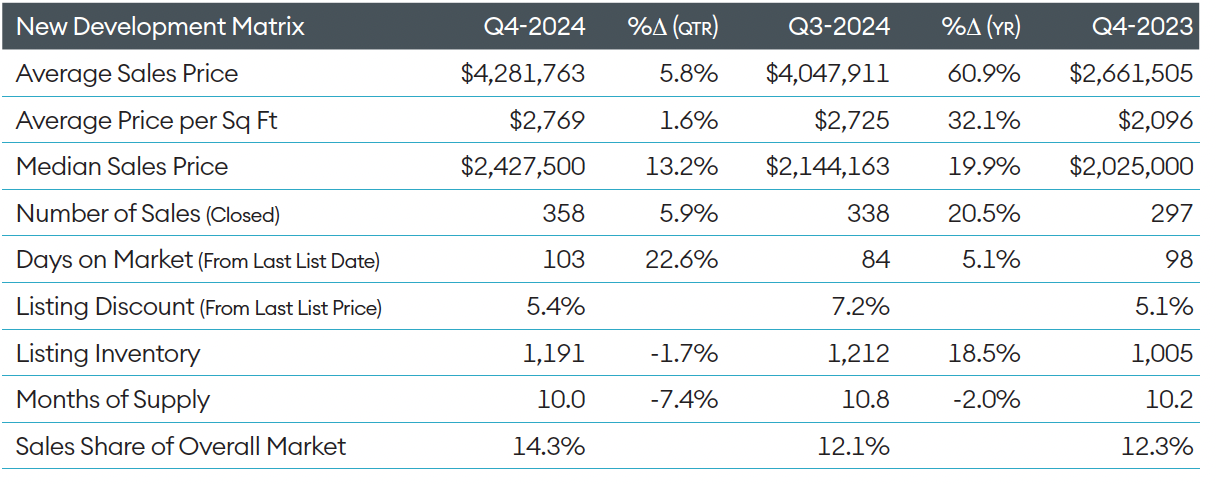
This sharp shift in size continues to cause havoc in new development price trends, currently causing outsized annual gains.
As a result, the median sales price for new development sales surged 19.9% over the same period, while both the average sales price and average price per square foot increased even more as the market share of new development sales expanded on top of the shift to more sales.
New development sales accounted for 14.3% of all co-op and condo closings in the most recent quarter, up from 12.3% in the same period last year and 28.4% of all condos, roughly the same as the long-term average. It’s hard to imagine the scale of the new development boom just over twenty years ago, where the market share was more than half of all closings for three straight quarters.
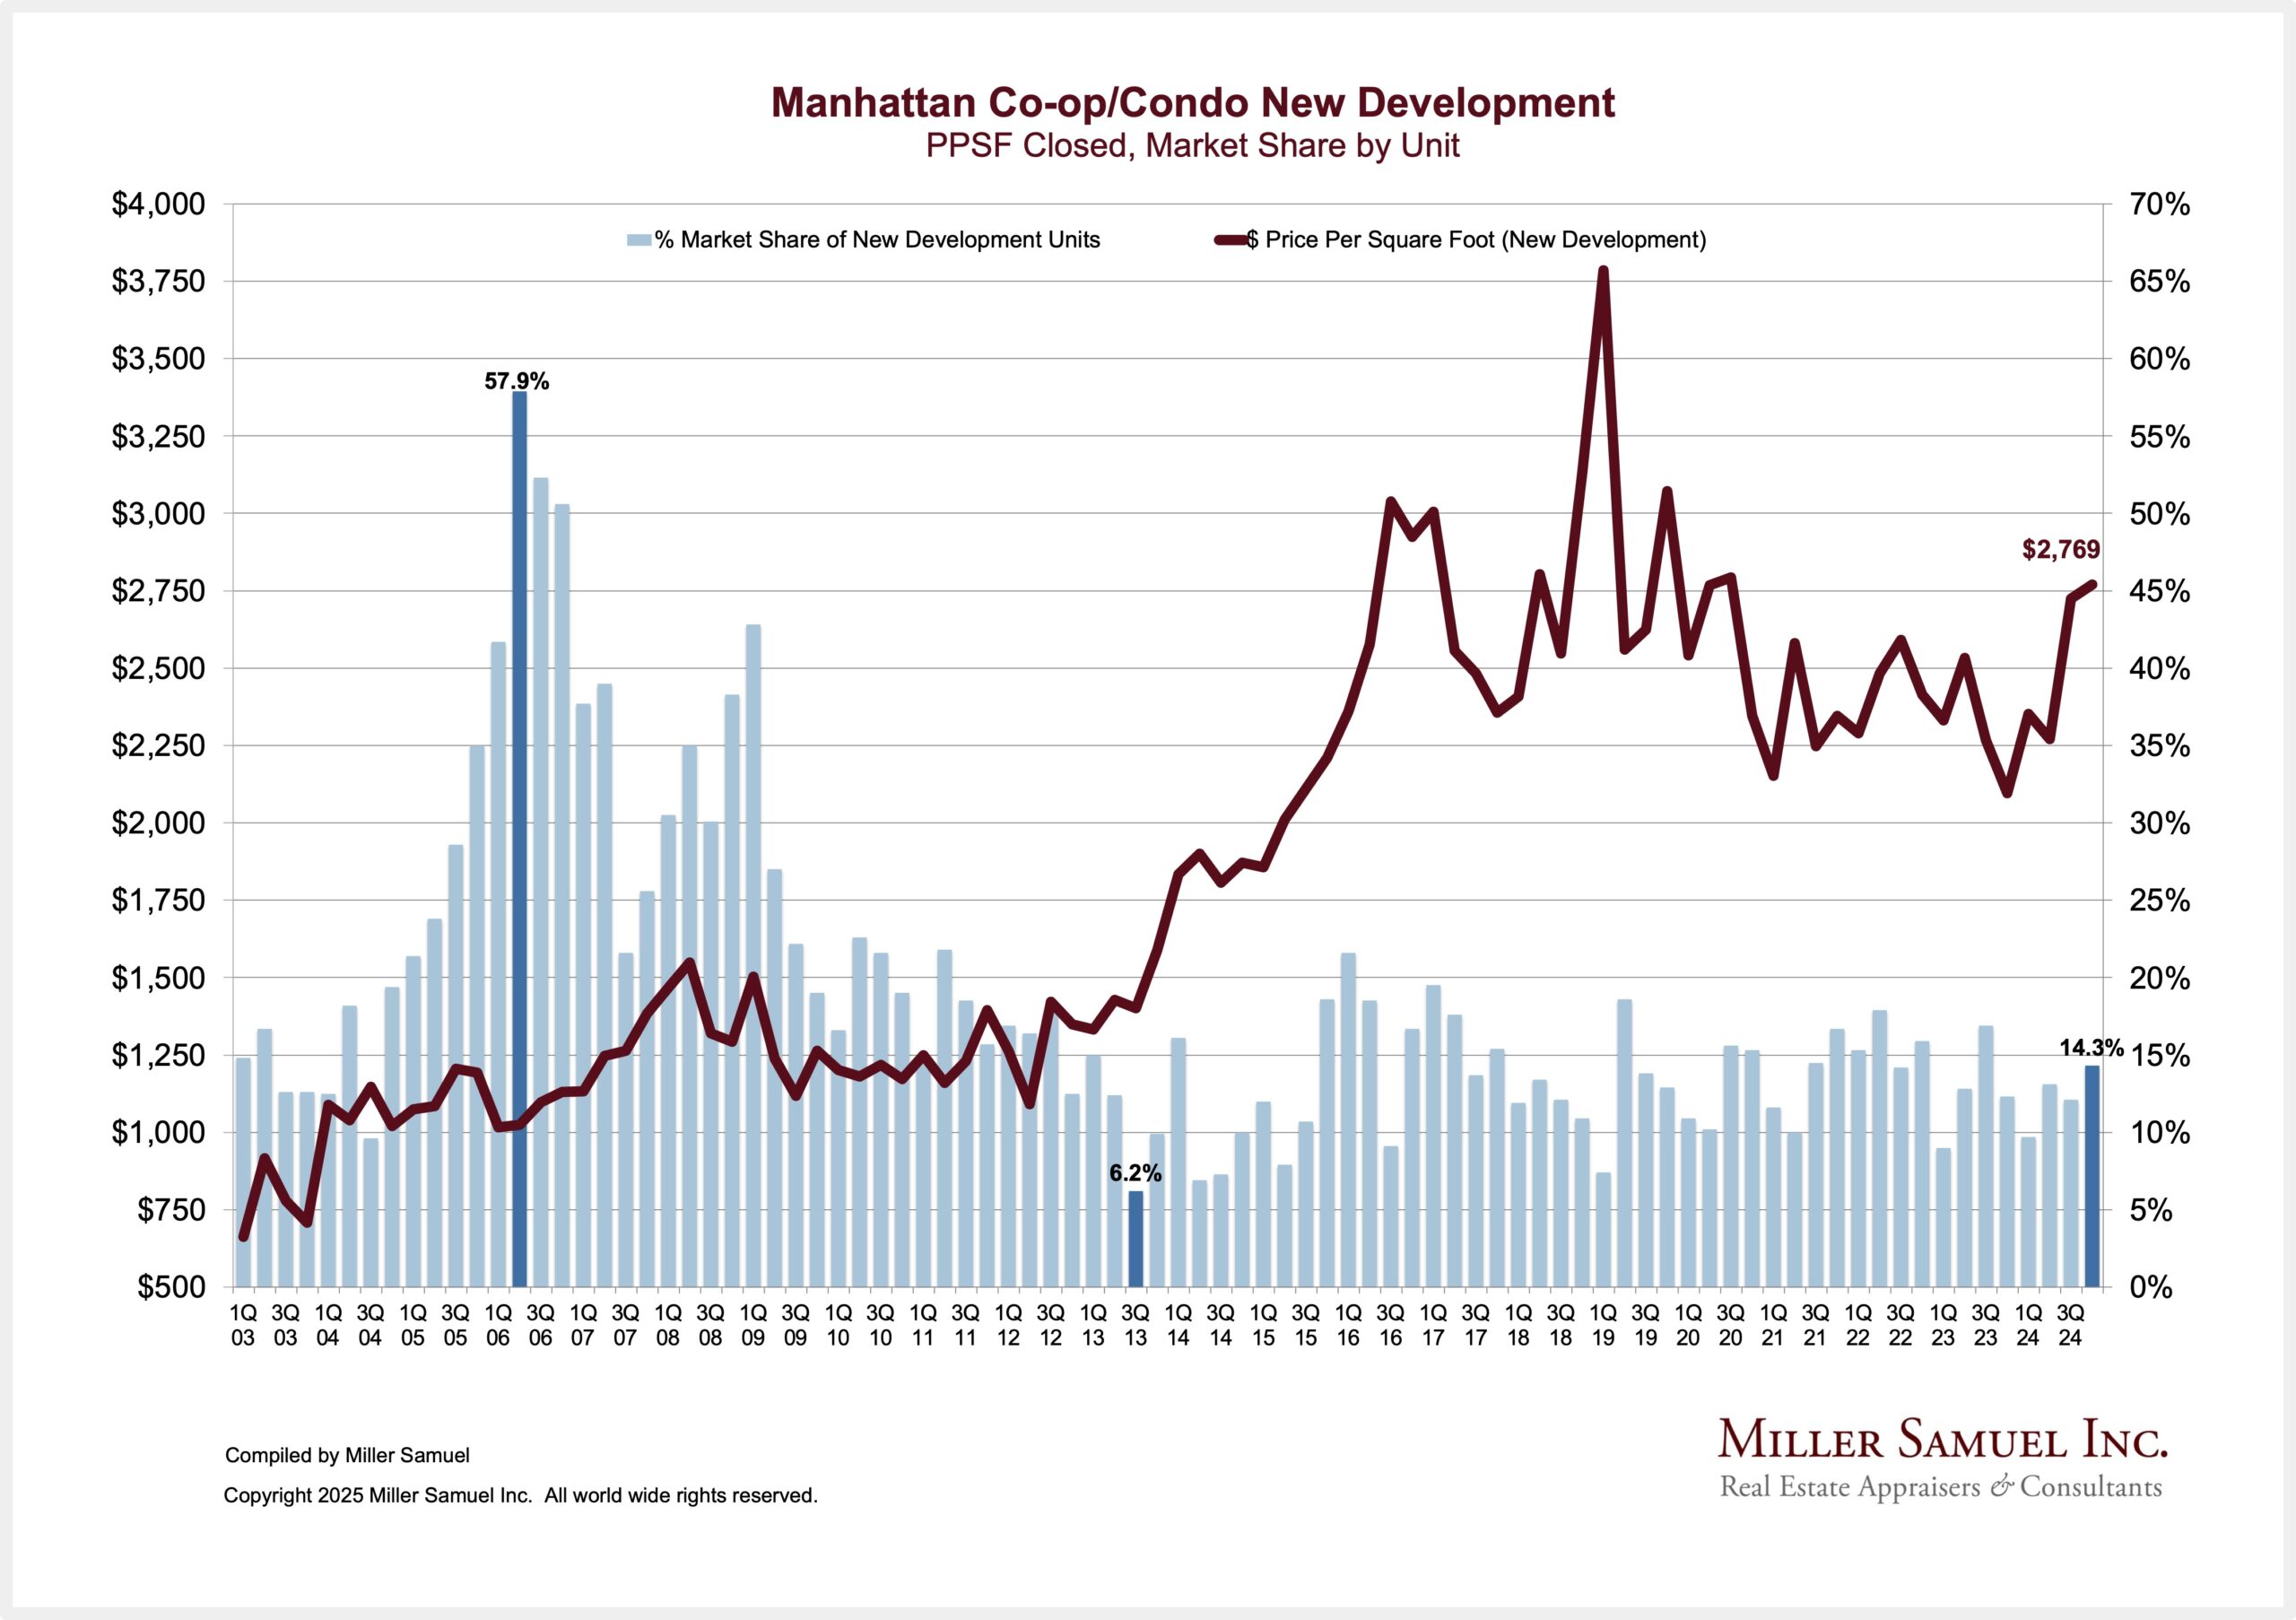
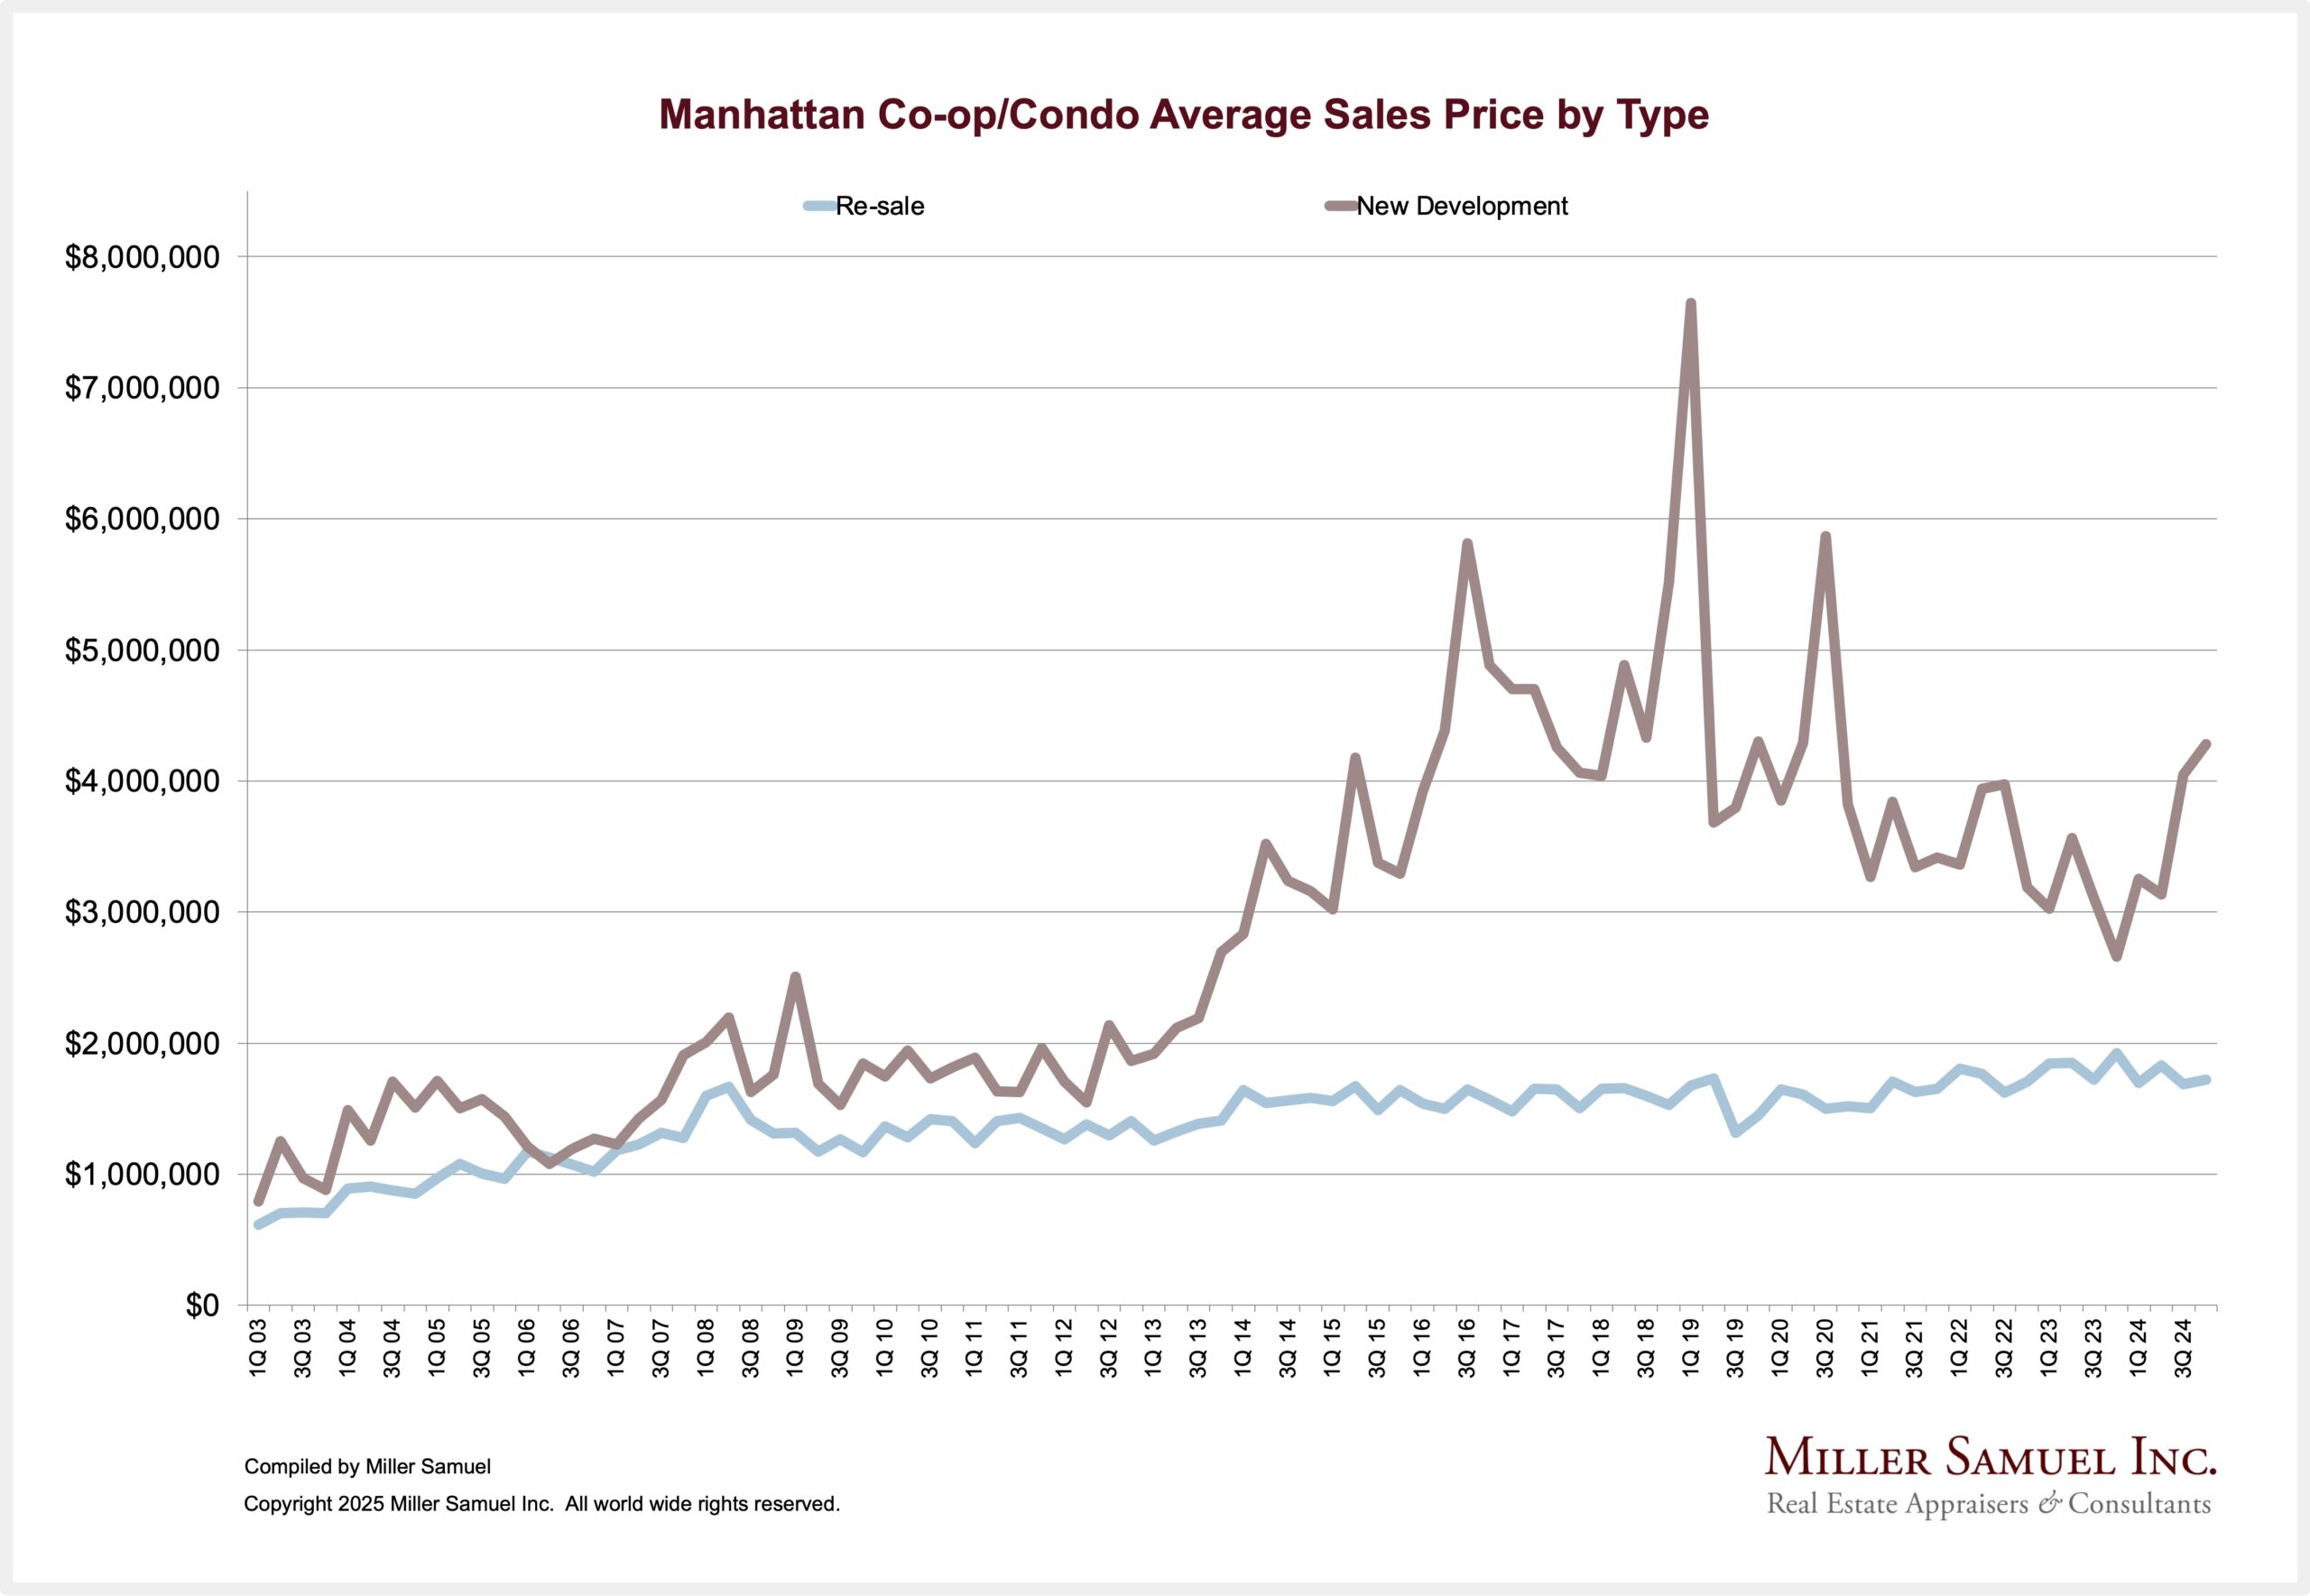
The volatility of average sales price trends for new development is much higher because the size of the units representing current demand continues to change a lot. In other words, the product design of new development is conceived four or more years prior to marketing, and local conditions may have changed before they entered the market. On the other hand, it is more accurate to think that re-sale trends reflect the current market zeitgeist and that the trend line has been relatively smooth, as noted in the following chart.
The Manhattan Re-Sale Market
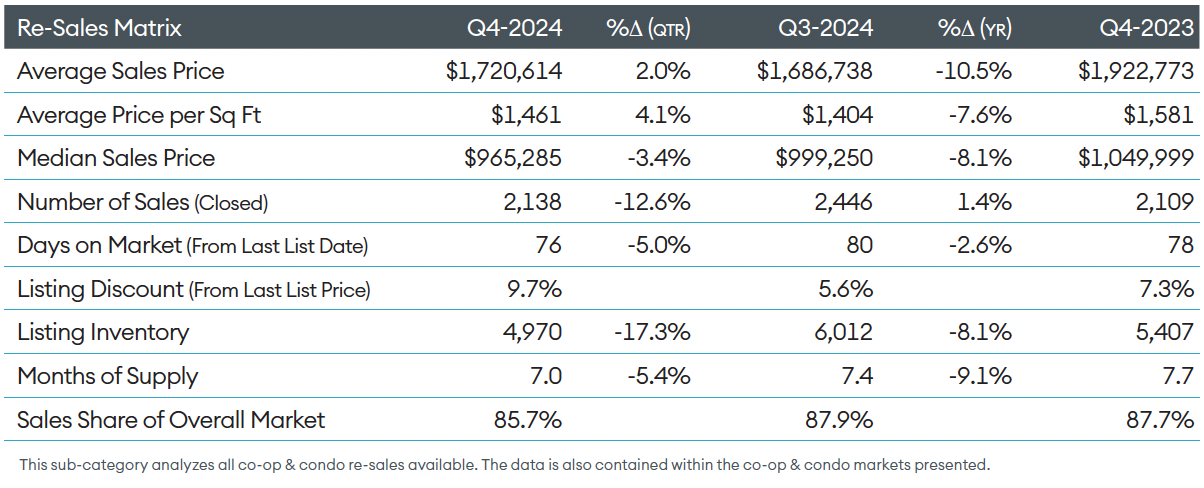
Re-sale (Existing) co-op and condo sales accounted for nearly 86% of all sales in Q4 (about normal) and, based on the above chart, have been essentially flat for the past decade. Any changes made have been relatively small during this period. When I spoke at a conference in China a while back, I was struck by their description of re-sale properties as “used” – a term that is never used for housing in the U.S. While re-sales dominate the market by sales in Manhattan, the vast majority of media coverage and reality shows skew towards new development. Why? Because re-sale market conditions tend to be more boring. Ha. What I find most interesting about the Q4 report results is that year over year, sales of re-sales rose 1.4% while sales in the much smaller new development market increased 20.5% over the same period. The higher end appears to be in a better position for 2025 as a result of elevated mortgage rates.
Final Thoughts
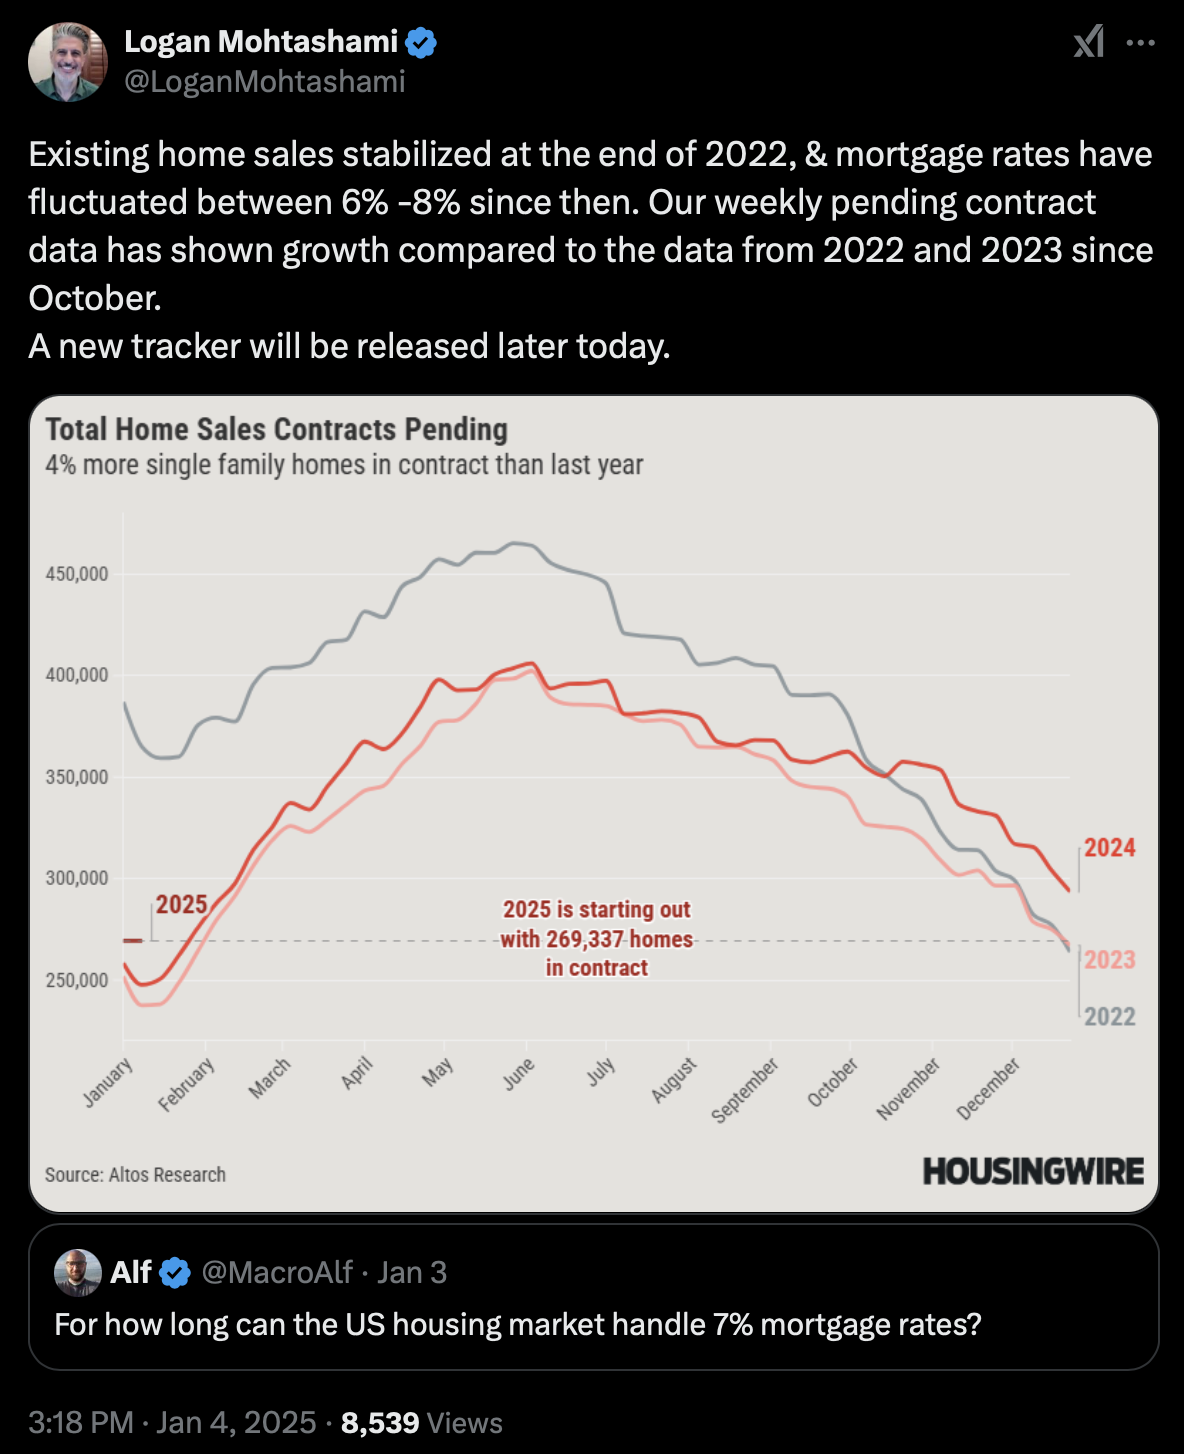
Like Manhattan, U.S. sales are trending higher despite 7% mortgage rates. 2024 existing sales are higher than the prior several years, and pending sales are up as well.
The ratio of new development sales to total sales in Manhattan long term is about 85% and actually traces the relationship between U.S. existing home sales and U.S. new construction sales. New development/construction seems to have the power to add more inventory to the market these days, but it doesn’t reflect the demand profile of what is needed as it tends to be higher priced. If new development is tripled nationally, it will hardly be enough to make housing more affordable.
The muscle behind the housing market these days skews to a costume that leans towards the higher end.
Tuesday Mailboxes, Etc. – Sharing reader feedback on Housing Notes.
January 3, 2024: The Housing Market Lists
- CRS – can’t remember sh*t!
- My favorite acronym is FFS. Keeps coming up for some reason.
Did you miss the previous Housing Notes?


![[Podcast] Episode 4: What It Means With Jonathan Miller](https://millersamuel.com/files/2025/04/WhatItMeans.jpeg)