- Chicago Has The Second-Highest CMBS Commercial Office Distress
- Office Leasing Price Trends Are Rarely Discussed Media Coverage
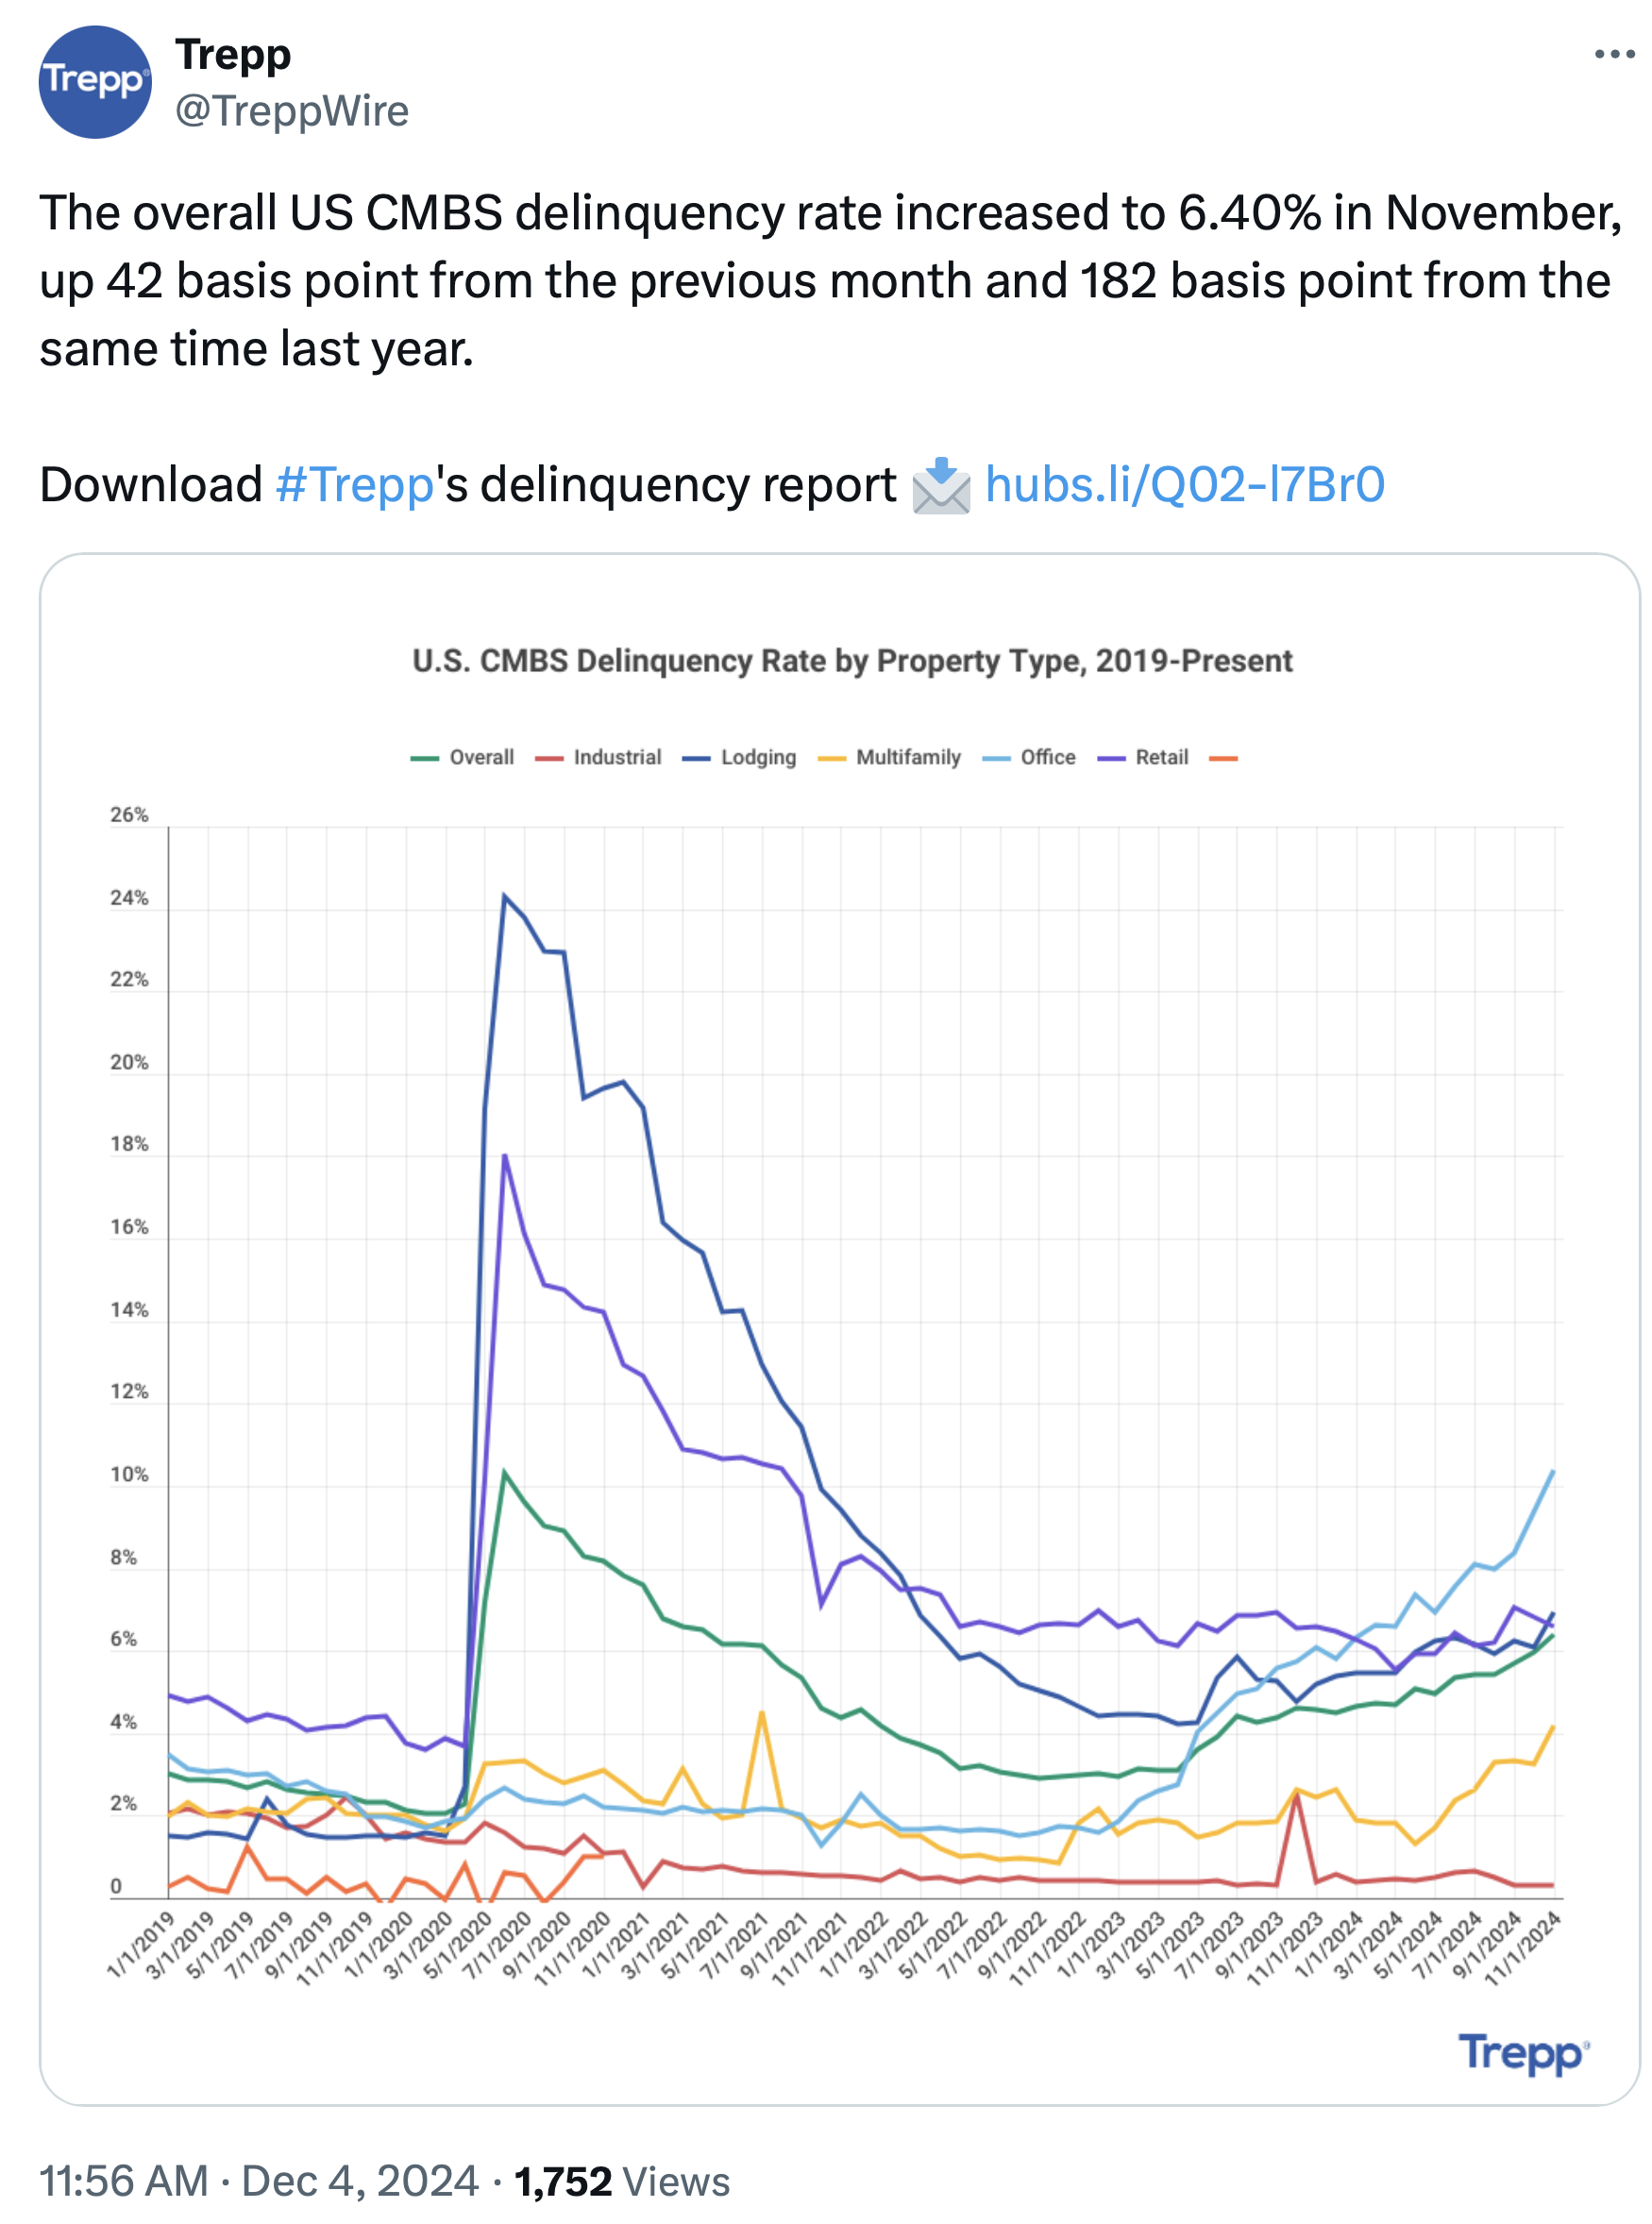
- Office Remains The Highest Distressed Commercial Asset Class
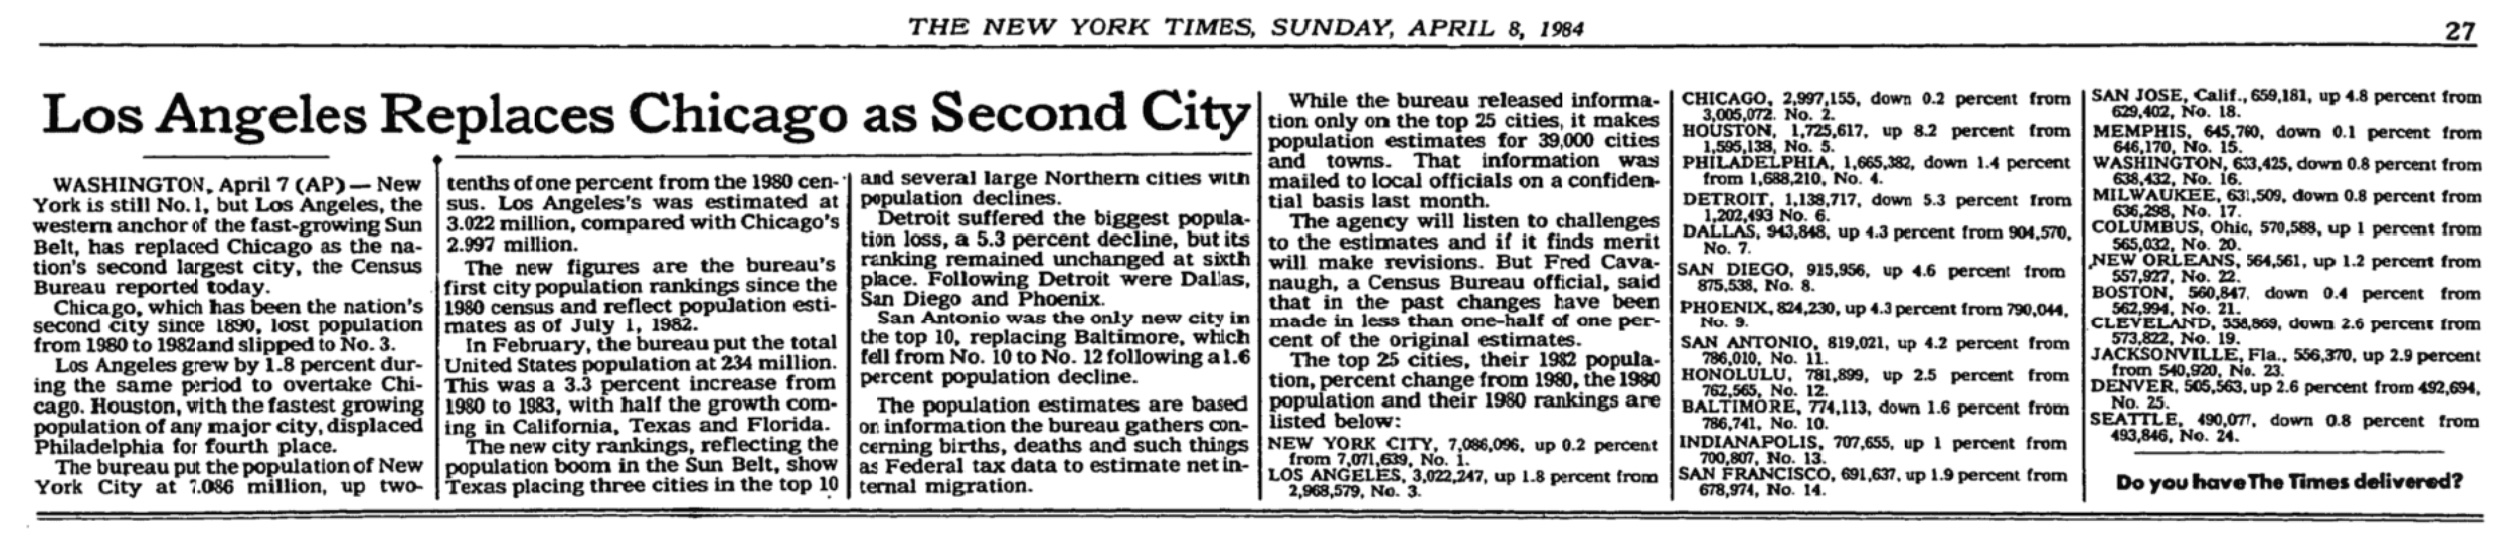
Our first jobs out of college in 1982 were in Chicagoland and my wife and I loved living there. One of the first things I did was learn where the name “Chicago” came from and have yet to meet a local who knows the answer. The Second City Improv is a stalwart of living in the Loop but admittedly terrifying to get called on when in the audience. Little did we know that at the same time as our introduction to the city, Chicago had lost its ranking as the “Second City” to Los Angeles by population but the nickname remains.
Perhaps the nickname can be applied to their distressed CMBS market. WFH (I no longer need to explain what THAT means) has changed everything. Chicago has the second-highest CMBS delinquency rate for US office markets.

Because of the much bigger commercial office market that exists in New York, the height of the above chart axis would have to be doubled to properly fit the distressed NYC CMBS.
So when I see headlines like this: NYC office market roars back to life, sending tenants scrambling: ‘Tighter than it was in 2019’ it is very confusing. To the casual observer, there needs to be an asterisk for clarification. The clarification is that the Class A, B & C office markets are very different. Class A seems stable for now but Class B & C are in bad shape. Trepp tells us that office CMBS distress is the commercial market leader exceeding 10%.
Second And Third City Office Distress
Hiten Samtani over at ten31 warned us about Chicago CMBS distress back in May saying that 75% of CMBS there was distressed. He’s a good follow to get the latest on the commercial real estate world.
And Chicago’s residential high-end housing market is stumbling.
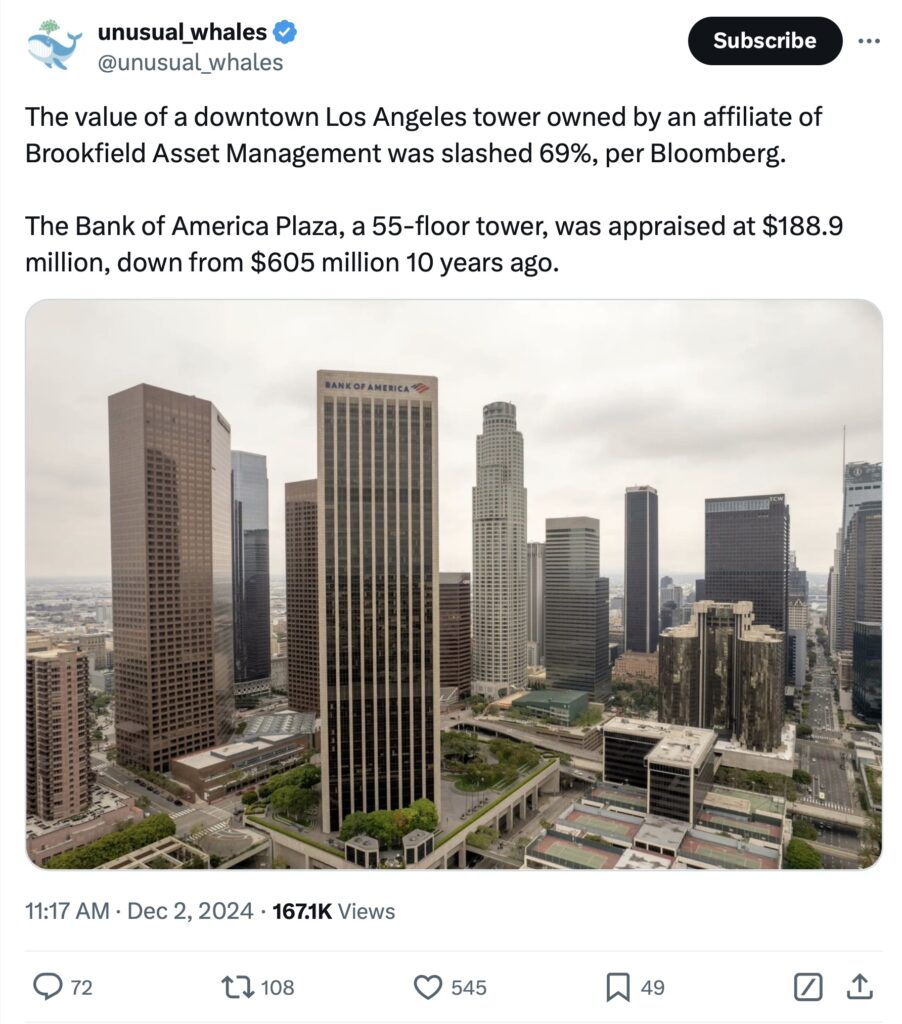
Los Angeles has a rising CMBS distress problem but it’s not as evolved as Second City.
Final Thoughts
While agreeing with the premise that there has been an uptick in Class A leasing activity, make sure you notice that nowhere in any coverage of the commercial office market are rental price trends ever discussed. In my experience, New York Class B & Class C have seen a massive decline in rent per foot but Class A rents have remained fairly stable in a “best and all the rest” scenario. However, the Class A segment accounts for the majority of media coverage of the distressed office market topic. This lack of transparency likely occurs because the source of data and insights within the commercial office leasing market are commercial brokers who are protecting relationships with their landlords.
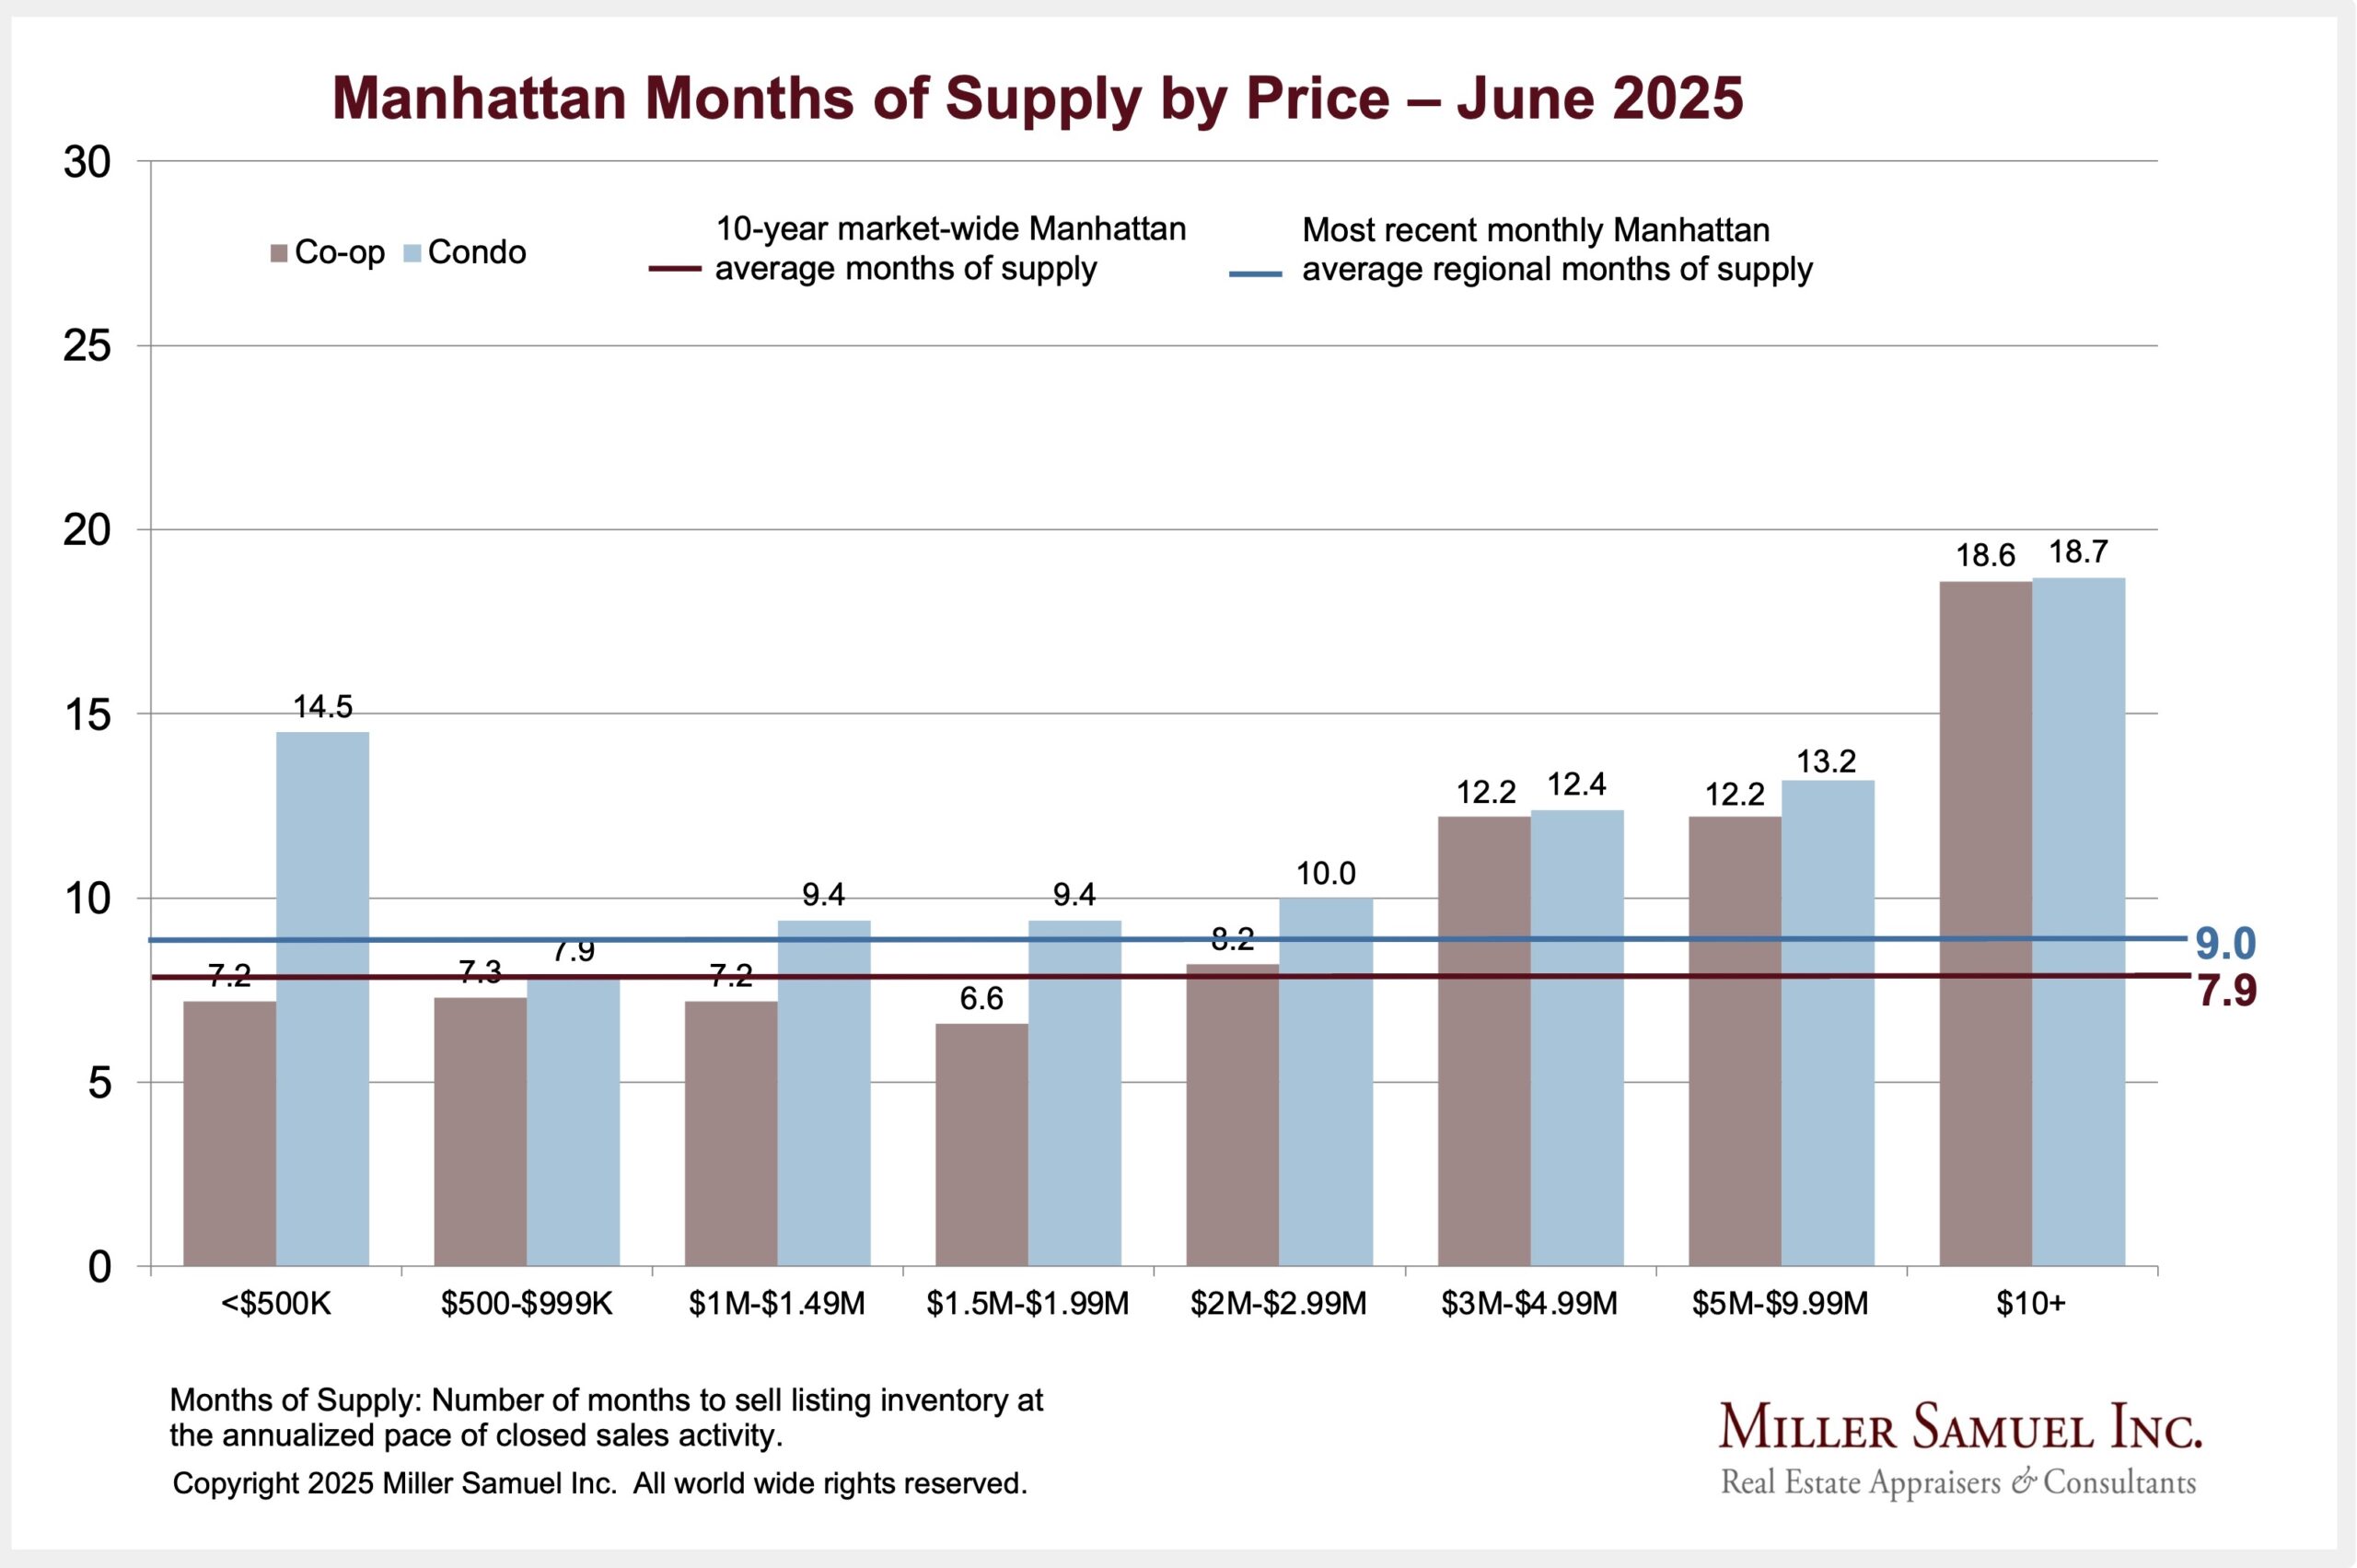
Speaking of segments, this is how it looks.
Did you miss the previous Housing Notes?

Housing Notes Reads
- NYC office market roars back to life, sending tenants scrambling: ‘Tighter than it was in 2019’ [New York Post]
- Helmsley Building’s value falls by 40%, appraiser says [Crain's New York]
- Values Of 2 Downtown LA Office Towers Plummet [Bisnow]
- U.S. Office Edges Closer To Recovery Than At Any Point Since Pandemic's Onset [Bisnow]
- CoStar News – First in pain, the Second City office market suffers the most blows to its CMBS mortgage pool [CoStar News]
- Exclusive | A partially built oceanfront mansion on one of the Hamptons’ most prestigious streets finally finds a buyer [New York Post]]
- The home price crash that hasn’t come [Sacramento Appraisal Blog]
- Fort Lauderdale goes glam, fancy office tenants, and a Boca eviction [Highest & Best]
- New York Made Airbnbs Harder to Find. Now It’s Reconsidering. [WSJ]
- NYC Enforcement Of The Rental Law Crushed Airbnb Listings. Weaker Rent Trends And High Cleaning Costs Are Next. – Housing Notes
- Spotlight: New York City’s Rental Housing Market [NYC Comptroller]
- NYC’s rules one year later: Higher prices for travelers, no housing impact [Airbnb]
Market Reports
- Elliman Report: Florida New Signed Contracts 11-2024 [Miller Samuel]
- Elliman Report: New York New Signed Contracts 11-2024 [Miller Samuel]


![[Podcast] Episode 4: What It Means With Jonathan Miller](https://millersamuel.com/files/2025/04/WhatItMeans.jpeg)