- Listing Inventory Continues To Be The Most Important Metric On Housing Market Performance
- The Rise Or Fall Of Listing Inventory Is A Local Market Metric
- Florida Is Seeing More Inventory Growth On The Gulf Side
I’ve touched on this issue before – there are a number of people on X/Twitter (which has officially become a digital cesspool) shilling for apps and services, by presenting supply in a misleading way. They look at specific markets, especially in the Sun Belt states where listings are rising faster than states to the north and seem to infer it represents the entire country. We recently released a slew of Florida housing market research and their inventory levels varied greatly. Generally, housing supply growth was heaviest on the Florida gulf coast and was more limited on the ocean side.
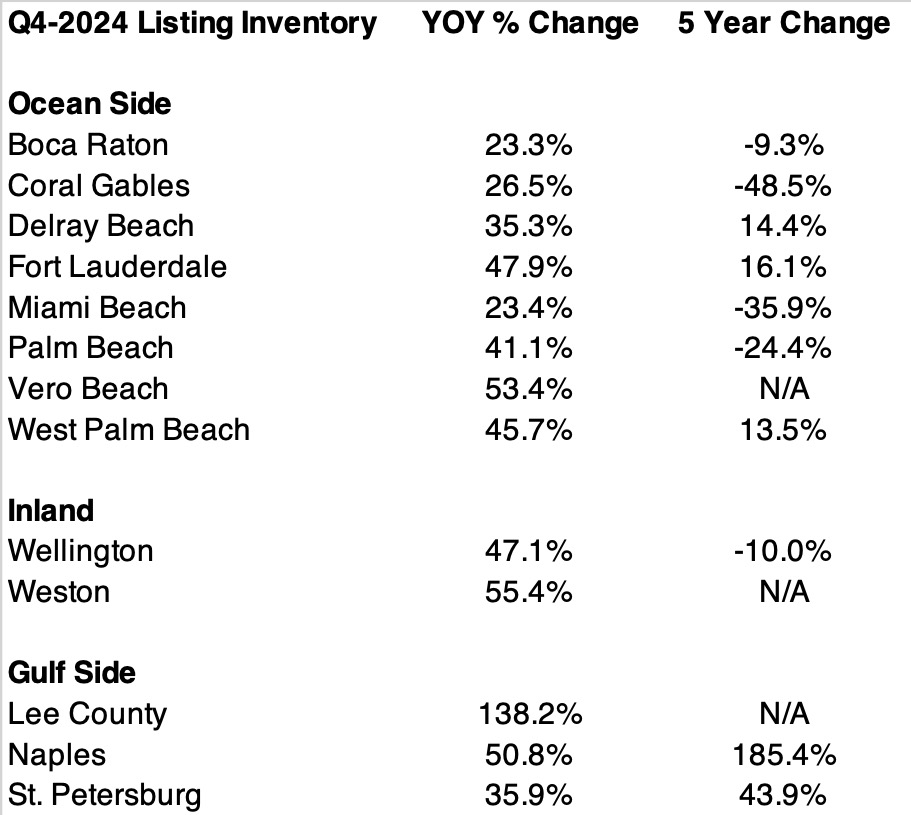
Florida Gulf Side Versus Ocean Side
The markets in the table above represent most of the Florida market reports I am currently authoring and because of the nature of MLS data quirks, I don’t have at least five years of historical data for some of the more recent markets I began covering.
The year over year change in listing inventory is fairly consistent across Florida with a roughly 50% annually rise in supply no matter where the market is located. The key point here is that surge in supply is coming from record or near-record lows (Going from 1 to 2 is a 100% increase). However when the markets are broken out by regions, the gulf side appears to have a lot more inventory that has built up over the past five years while many of the ocean side listings remain below the levels of five years ago (pre-pandemic). I’d like to suggest that the last few years of Florida hurricane events have been concentrated on the gulf side.
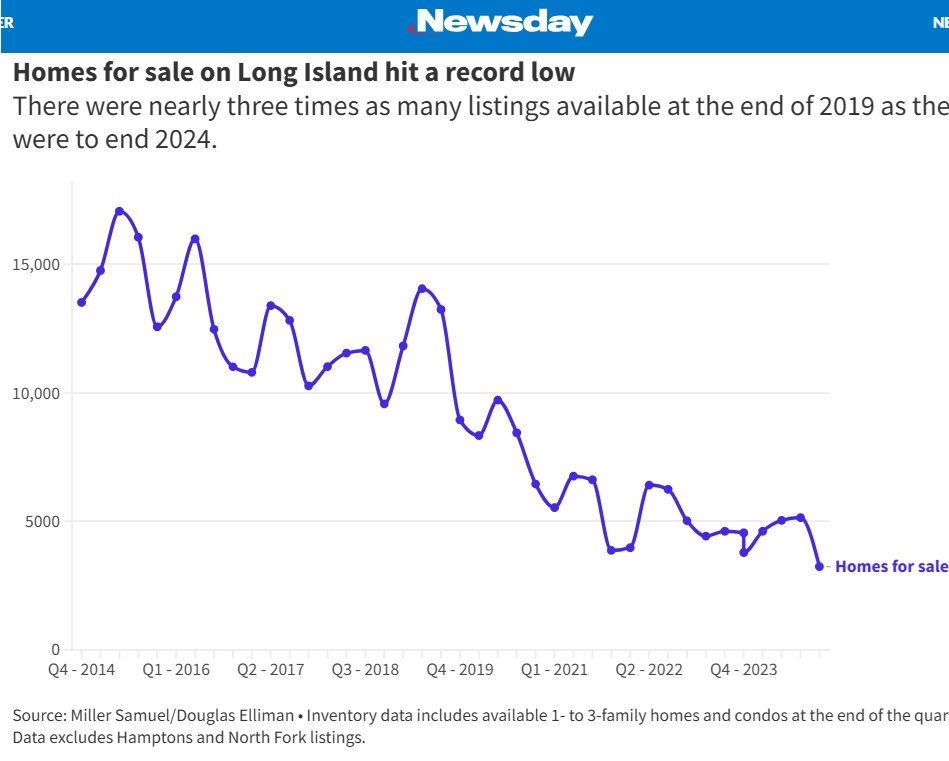
Long Island Inventory Falls To Record Low
Long Island, New York which represents a big chunk of the housing market outside of New York City has seen listing inventory continue to collapse. Newsday chronicled the drop in supply.
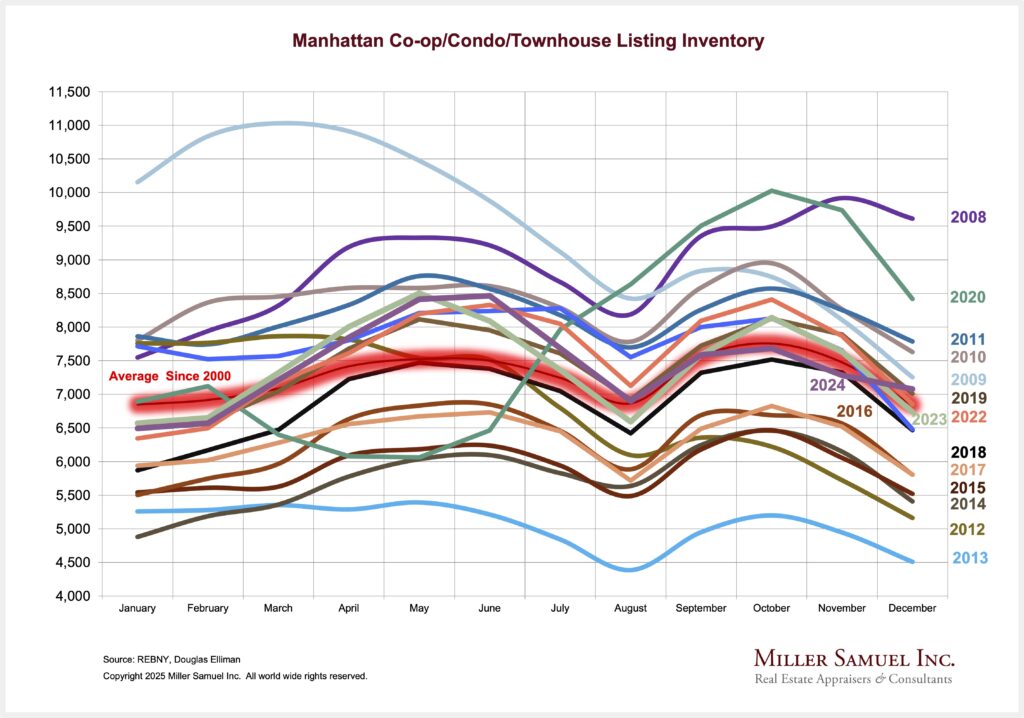
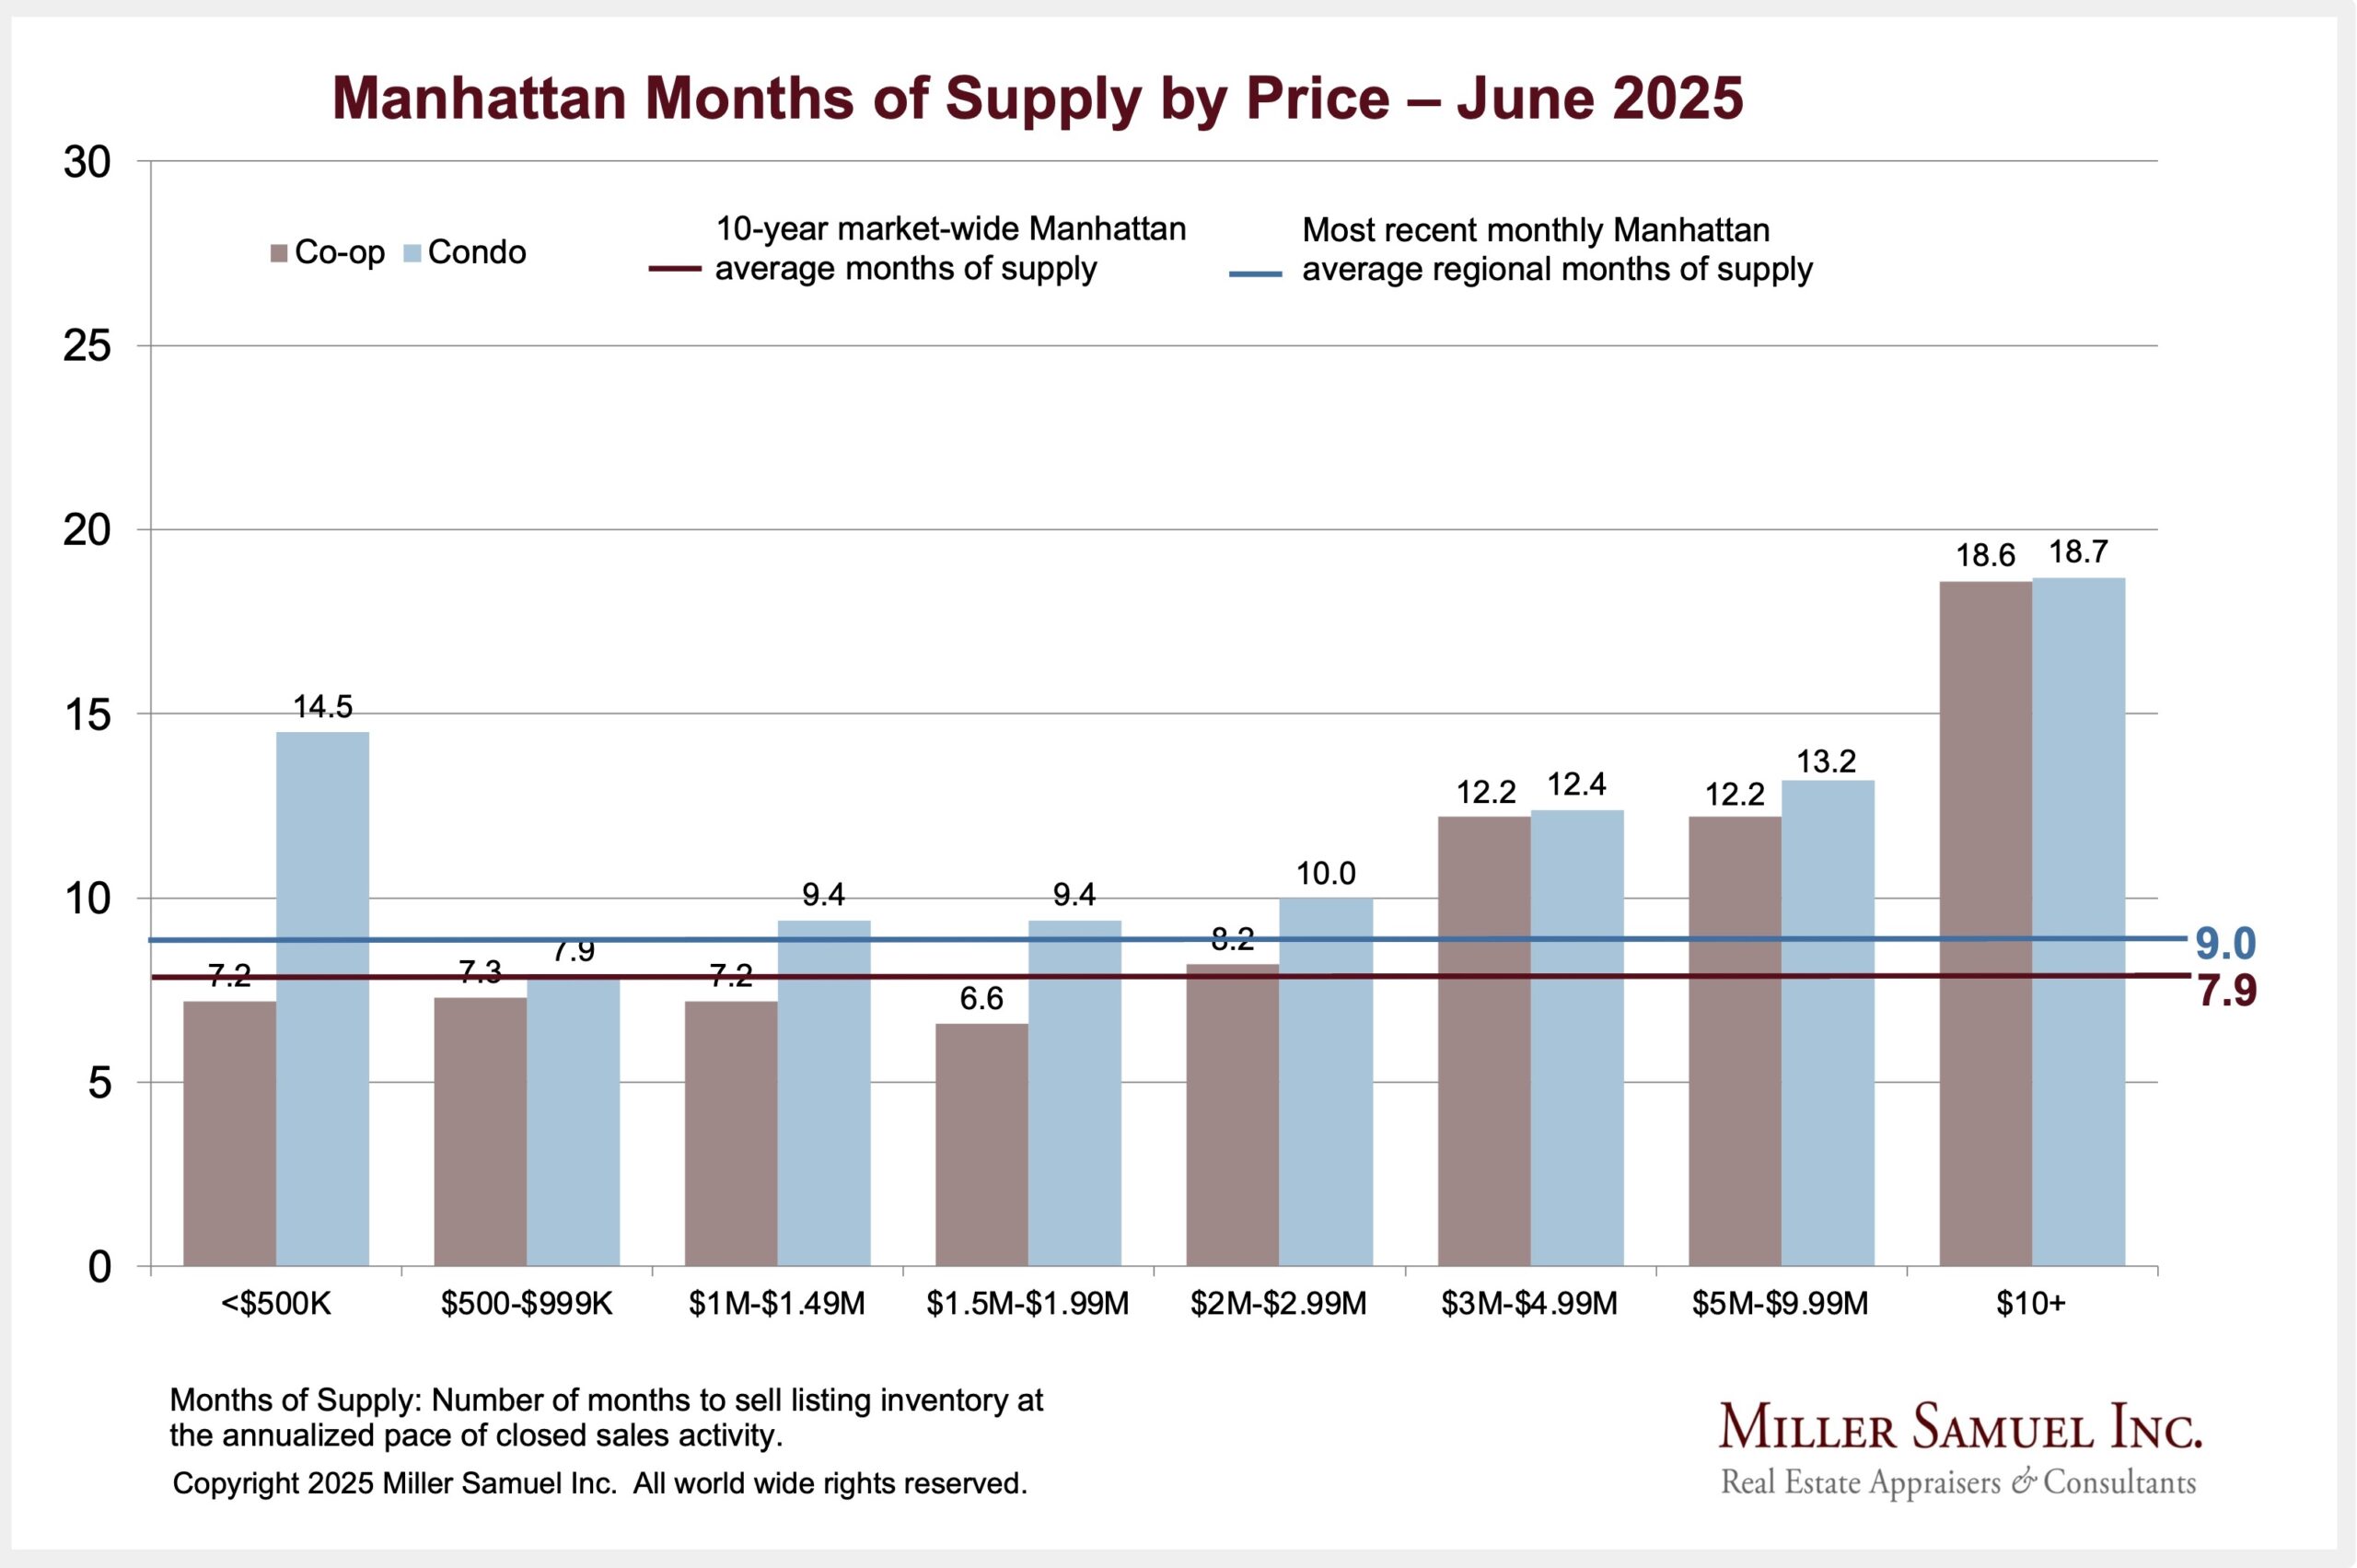
Manhattan Listing Inventory Is Average
I’ve been manually tracking inventory for nearly 25 years and current levels are consistent with the long-term average. Many in the Manhattan brokerage industry have the sense that supply is tight. However, the empirical reality is that the pricing of inventory tends to be high, meaning that many of those listings are “on” the market but not “in” the market so supply feels constrained to agents trying to find properties for their customers.
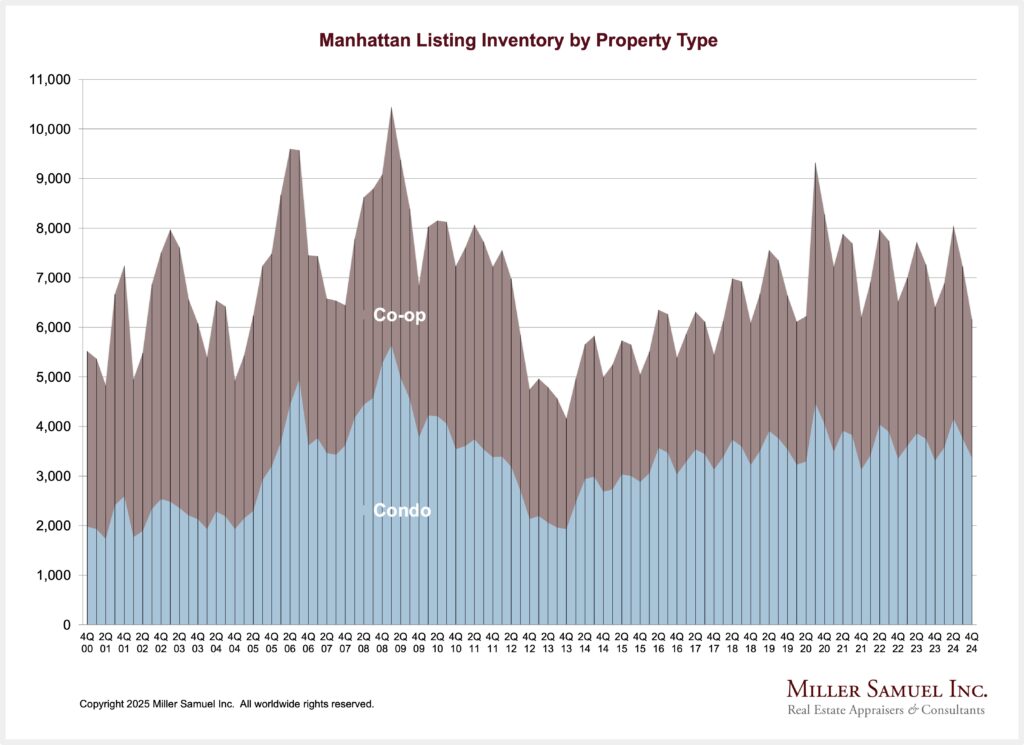
Notice how listing inventory for 2024 is aligned with the overall average (apologies for the busy-ness of the chart).
Final Thoughts
There is no doubt that listing inventory is moving higher as sales have slowed – thanks to higher mortgage rates. But as the saying goes, all real estate is local and that includes listing inventory. As listing rises, sales will rise even though U.S. existing sales are currently at a 30-year low (gift link).
With pending home sales rising, this suggests a bottom for existing home sales. Just like the use of a font saved NYC.
Did you miss the previous Housing Notes?

January 23, 2025
Luxury Second-Home Markets Remain Unscathed And Are Selling Quite Well. Thank You.
Image: Grok
Housing Notes Reads
- 😲 Sticker Shocked [Highest & Best]
- Vail Resorts Has an Epic Problem [Wall Street Journal]
- Umansky, Haber’s American Real Estate Association picks up NYRAC [The Real Deal]
- Palm Beach house sales bustled in 2024 but condos, not so much, year-end reports show [Palm Beach Daily News]
Market Reports
- Elliman Report: Orange County Sales 4Q 2024 [Miller Samuel]
- Elliman Report: Los Angeles Sales 4Q 2024 [Miller Samuel]
- Elliman Report: Long Island Sales 4Q 2024 [Miller Samuel]


![[Podcast] Episode 4: What It Means With Jonathan Miller](https://millersamuel.com/files/2025/04/WhatItMeans.jpeg)